GBP/USD Price Analysis: Bulls retreat but will be back for more
|
- GBP/USD bulls are testing the commitments of the bears.
- There is a case to be made for the upside vs a longer-term bearish bias.
As per the prior analysis from last week, GBP/USD: Bears back in town, but an upside correction is on the cards, the price has indeed moved to the upside.
The following series of charts illustrates the market structure and a bearish bias according to the longer-term charts. with the possibility of a deeper test of the monthly supply zone.
Prior analysis, daily charts
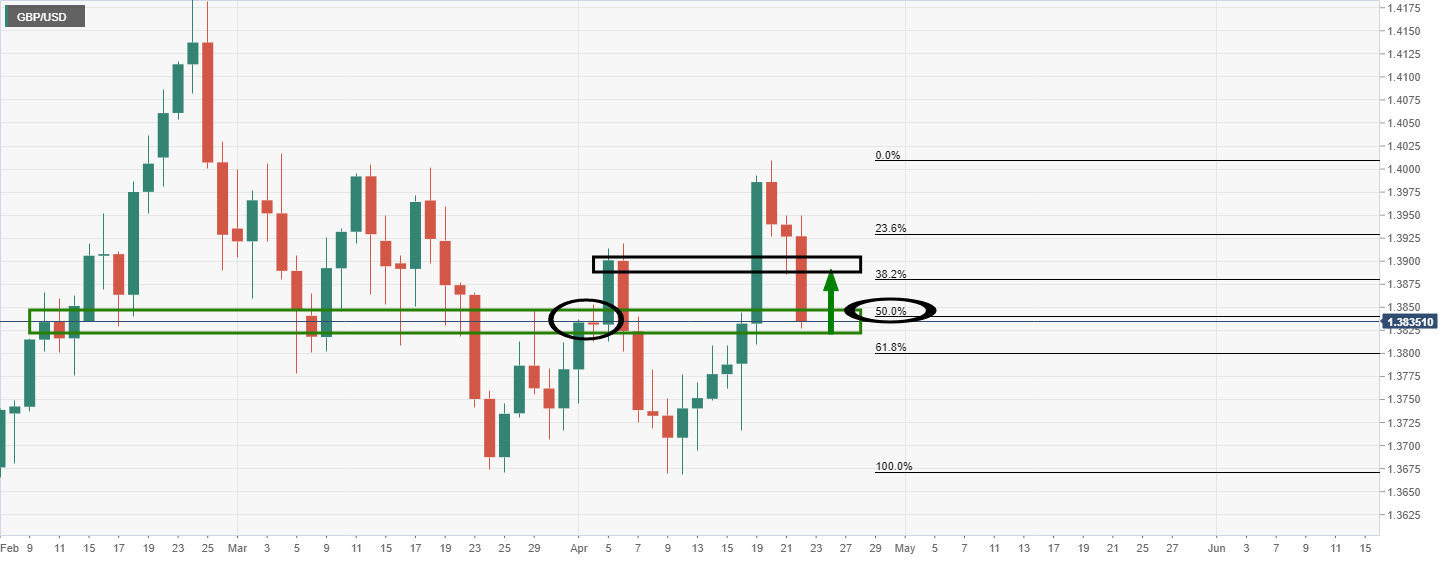
As illustrated, the price has made a 50% mean reversion and is testing old daily support.
Significantly, the price is meeting an interruptive old resistance candle in from 2 April business. Habitually, such candles act as a firm support or resistance.
At this juncture, an upside correction would be expected prior to the next leg to the downside.
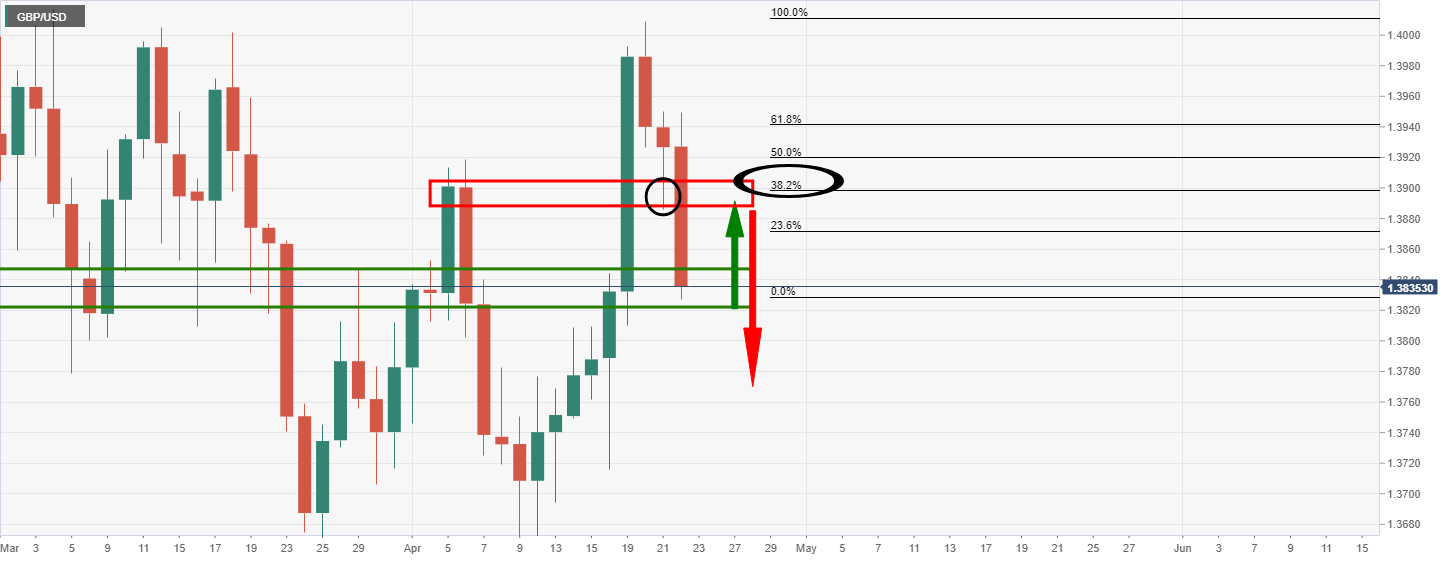
Live market analysis
So far so good:
As can be seen, the price has indeed made an advance to the forecasted resistance zone.
However, that is not to say that we have seen the last of the bulls for the immediate future.
The daily candle, so far, is bullish and the rejection from resistance, given how late into the New York day that we are, is most probably going to be challenged by the bulls again in forthcoming sessions.
The wick on the daily candle represents a 4-hour correction of the bullish impulse.
Corrections habitually lead to a continuation of the trend, so we may see the resistance come under pressure once again prior to the bears taking over and the next daily bearish impulse.
4-hour chart
As can be seen, there is a meanwhile resistance on the 4-hour that could lead to a bearish head & shoulders that would negate the upside test of resistance again.
Daily chart
Meanwhile, the downside on the daily chart may look something along the lines of the following if the 4-hour resistance gives and the daily tests at daily resistance fail over the course of the coming days:
Or, if the price breaks 4-hour resistance then the bulls will be in play for a daily upside continuation:
4-hour & daily charts
Looking forward, the preference for the bearish bias follows an analysis done on the longer-term charts as follows:
Now, this raises a problem for the bears. Traders need to be aware.
While the W-formation is bearish, there is also the probability that the prior week's candle which has left a bullish close and wick will engage the bulls for a retest of the weekly resistance first.
Monthly chart
Moreover, the monthly chart has already made a 38.2% Fibonacci retracement of the last bullish impulse.
Therefore, there are defiantly risks to the upside from this juncture while support holds on the monthly time frame.
With that being said, the upside is limited while below the supply zone, as illustrated in the following chart:
Information on these pages contains forward-looking statements that involve risks and uncertainties. Markets and instruments profiled on this page are for informational purposes only and should not in any way come across as a recommendation to buy or sell in these assets. You should do your own thorough research before making any investment decisions. FXStreet does not in any way guarantee that this information is free from mistakes, errors, or material misstatements. It also does not guarantee that this information is of a timely nature. Investing in Open Markets involves a great deal of risk, including the loss of all or a portion of your investment, as well as emotional distress. All risks, losses and costs associated with investing, including total loss of principal, are your responsibility. The views and opinions expressed in this article are those of the authors and do not necessarily reflect the official policy or position of FXStreet nor its advertisers.