GBP/USD Price Analysis: Bulls are well-set to poke 1.2100 hurdle
|
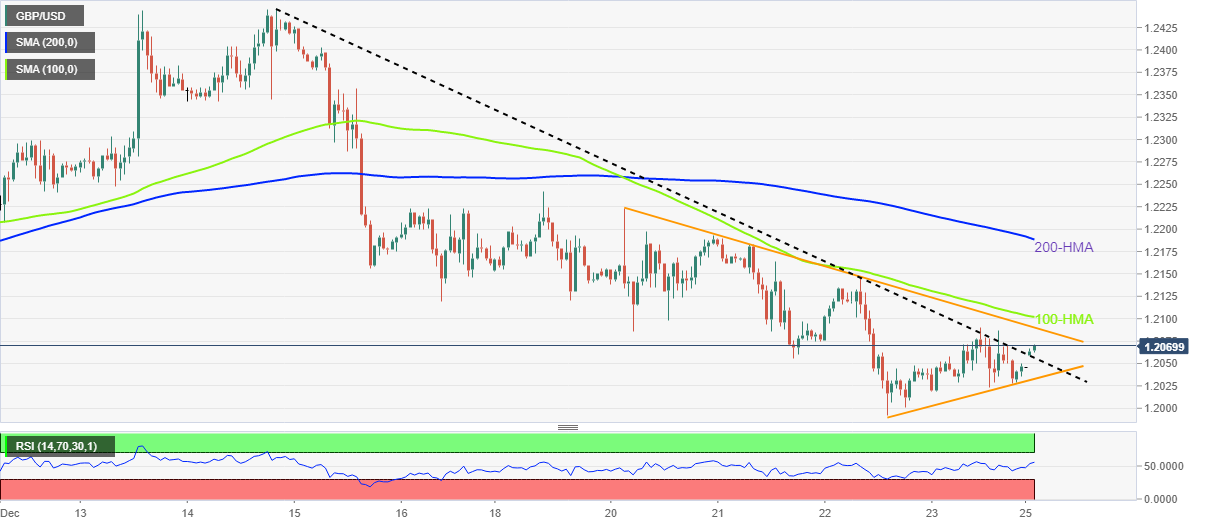
- GBP/USD crosses two-week-old resistance line to aim for recovery.
- Short-term descending trend line, 100-HMA guard immediate advances, upward-sloping support line from Thursday challenges bears.
- RSI conditions suggest further consolidation of recent losses.
GBP/USD picks up bids to 1.2067 as the Cable traders lick their wounds after three consecutive weekly losses during early Tuesday. In doing so, the quote also justifies the recent upside break of a two-week-old resistance line, now support around 1.2055.
The resistance breakout joins a firmer RSI (14) to also suggest the GBP/USD pair’s further advances.
However, the convergence of a downward-sloping resistance line from December 20, as well as the 100-HMA, challenges short-term advances of the Cable pair near 1.2100.
Following that, a run-up towards the 200-HMA level surrounding 1.2190 can’t be ruled out. Though, December 19 swing high near 1.2245 holds the key to the GBP/USD pair’s further upside.
On the contrary, the GBP/USD pair’s declines below the resistance-turned-support line, near 1.2055 by the press time, could test an ascending support line from Thursday, close to 1.2030.
Should the GBP/USD prices remain weak past 1.2030, the 1.2000 psychological magnet will challenge the bears before directing them to the latest bottom, also the monthly low, surrounding 1.1990.
Overall, GBP/USD remains on the bear’s radar despite the latest recovery moves. However, an upside clearance of 1.2245 could give control to the buyers.
GBP/USD: Hourly chart
Trend: Limited upside expected
Information on these pages contains forward-looking statements that involve risks and uncertainties. Markets and instruments profiled on this page are for informational purposes only and should not in any way come across as a recommendation to buy or sell in these assets. You should do your own thorough research before making any investment decisions. FXStreet does not in any way guarantee that this information is free from mistakes, errors, or material misstatements. It also does not guarantee that this information is of a timely nature. Investing in Open Markets involves a great deal of risk, including the loss of all or a portion of your investment, as well as emotional distress. All risks, losses and costs associated with investing, including total loss of principal, are your responsibility. The views and opinions expressed in this article are those of the authors and do not necessarily reflect the official policy or position of FXStreet nor its advertisers.