GBP/JPY Price Analysis: Plunges 200 pips from around 166.00, back below 164.00
|
- GBP/JPY formed an inverted hammer, meaning sellers are in charge.
- The GBP/JPY would face strong support at the confluence of the 100/200/20-day EMAs.
- GBP/JPY Price Analysis: In the near term, it’s neutral to upward biased.
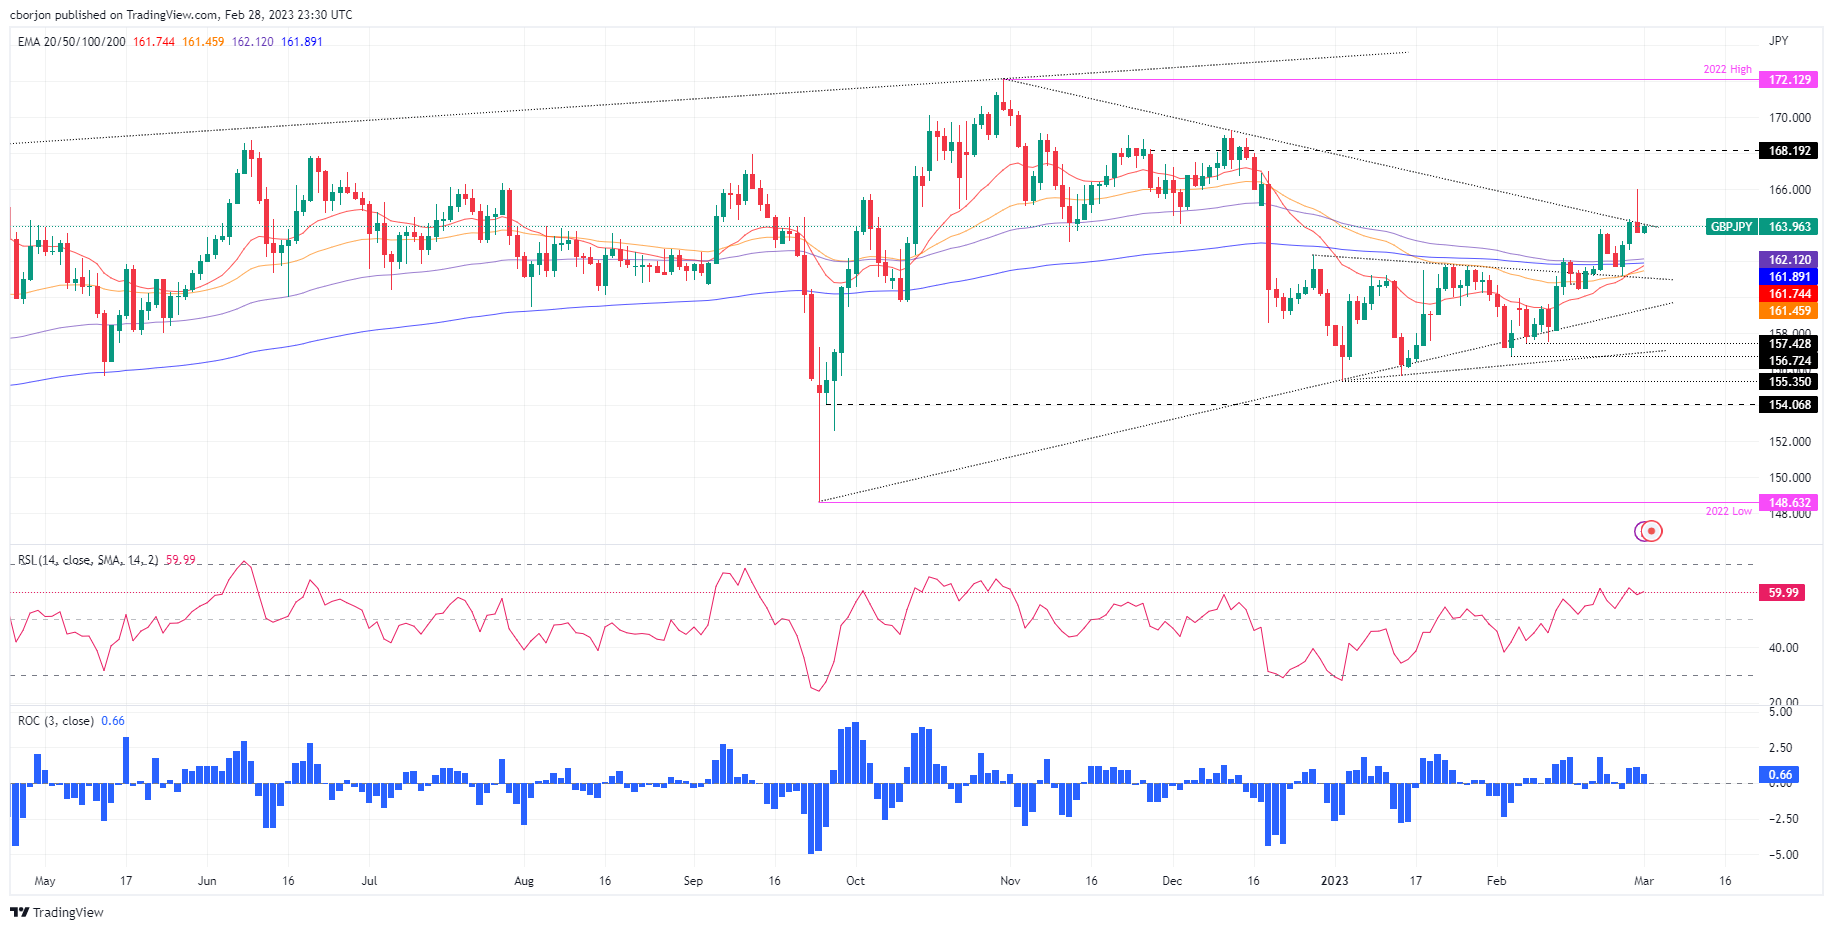
The GBP/JPY registers a minimal upside as Wednesday’s Asian session begins. On Tuesday, the GBP/JPY printed losses of 0.35% and formed an inverted hammer, meaning that further downside is expected. At the time of typing, the GBP/JPY exchanges hands at 163.90 after hitting a YTD high on Tuesday of 166.00.
GBP/JPY Price Action
After hitting a new year-to-date high, the GBP/JPY retraced more than 200 pips and achieved a daily close below 163.60. Traders should be aware that the cross-currency pair pierced a four-month-old downslope trendline, but buyers unable to commit to its longs and sellers stepping in around 166.00 dragged the exchange rates lower.
The Relative Strength Index (RSI), albeit in bullish territory, is almost flat, while the Rate of Change (RoC) suggests that buying pressure is waning. Therefore, further downside is expected.
Hence, the GBP/JPY first support would be the February 28 daily low of 163.58, which, once cleared, would exacerbate a fall toward the weekly low of 162.59. A breach of the latter would send the GBP/JPY toward the confluence of the 100 and the 20-day Exponential Moving Averages (EMAs) at around 161.89/74, respectively.
As an alternate scenario, the GBP/JPY first resistance would be 164.00. Once the GBP/JPY hurdles that level, and the 165.00 figure would be the next to be challenged by Pound Sterling (GBP) buyers, ahead of the YTD high at 166.00.
GBP/JPY Daily chart
GBP/JPY Key technical levels
Information on these pages contains forward-looking statements that involve risks and uncertainties. Markets and instruments profiled on this page are for informational purposes only and should not in any way come across as a recommendation to buy or sell in these assets. You should do your own thorough research before making any investment decisions. FXStreet does not in any way guarantee that this information is free from mistakes, errors, or material misstatements. It also does not guarantee that this information is of a timely nature. Investing in Open Markets involves a great deal of risk, including the loss of all or a portion of your investment, as well as emotional distress. All risks, losses and costs associated with investing, including total loss of principal, are your responsibility. The views and opinions expressed in this article are those of the authors and do not necessarily reflect the official policy or position of FXStreet nor its advertisers.
