GBP/JPY Price Analysis: Bulls take a respite after printing a YTD high at 167.00
|
- GBP/JPY uptrend is still active but facing tough resistance at around 167.00.
- Downside risks in the GBP/JPY lie below 166.16, followed by 166.00.
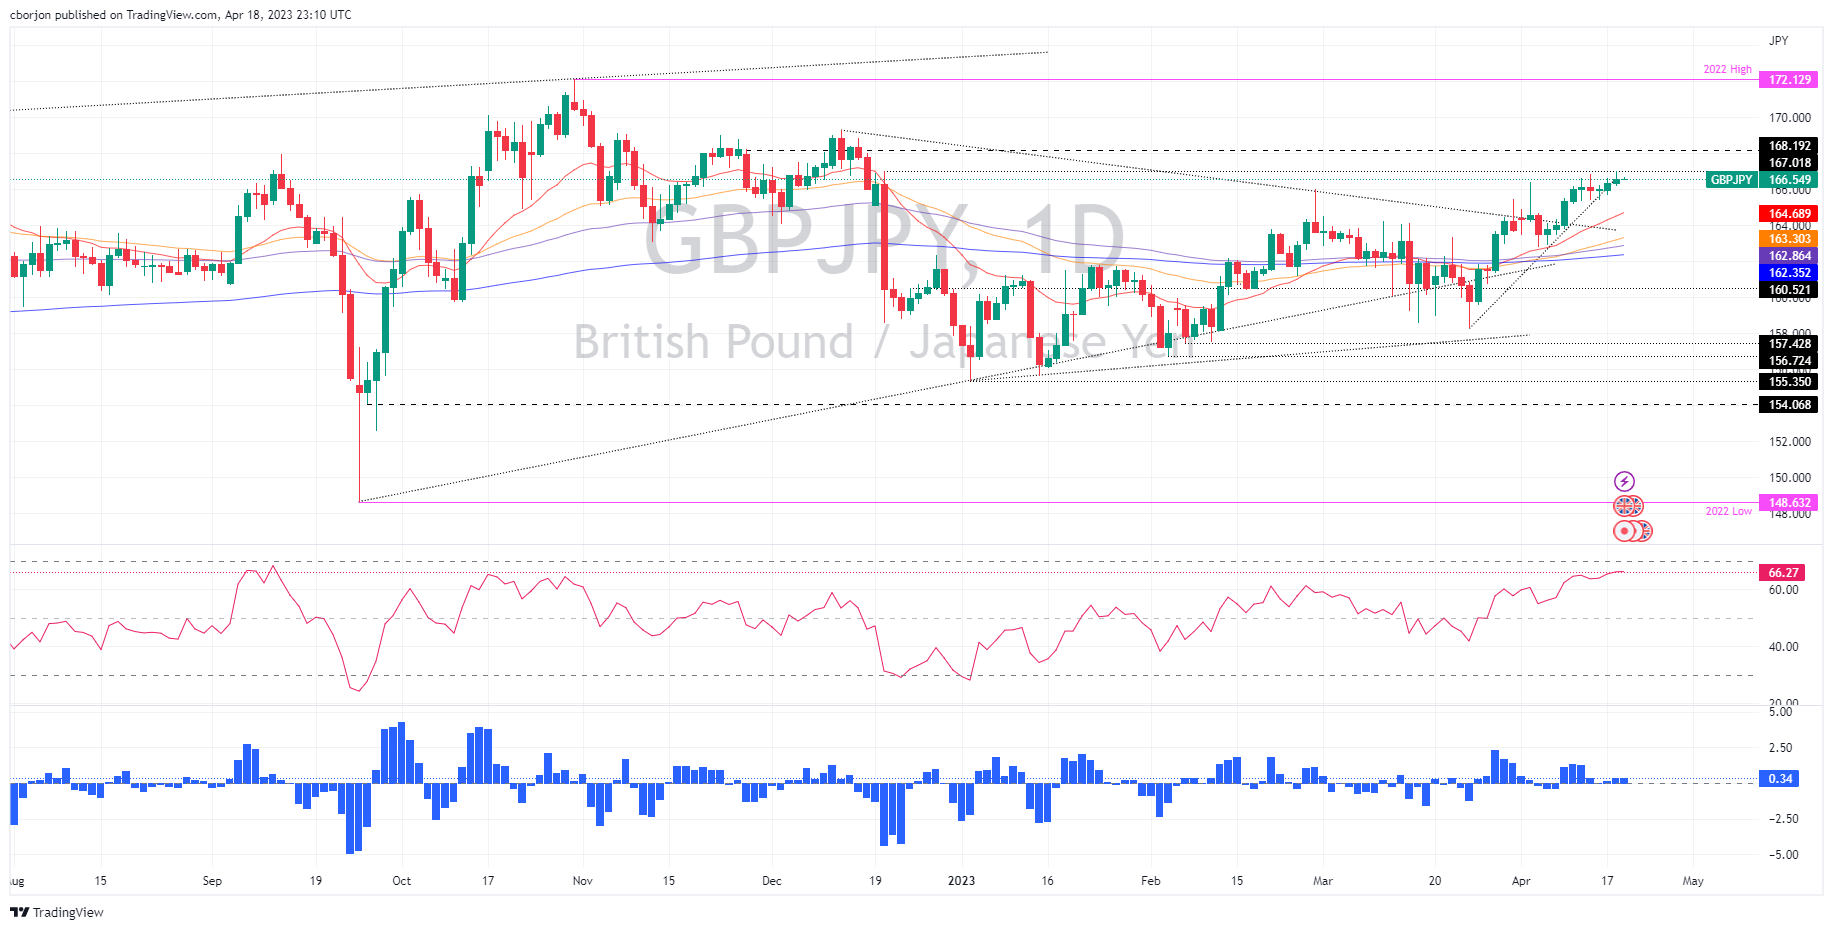
The GBP/JPY stalls at around 166.60s, unable to crack the YTD high at 167.00, printed on Tuesday, as Wednesday’s Asian session commence. Nevertheless, the GBP/JPY uptrend remains intact unless the quote tumbles below the last week’s low of 165.40, which could pave the way for further losses.
GBP/JPY Price Action
Given the backdrop, the GBP/JPY recent trend stays in play, though it’s facing a wall of resistance. However, if it clears 167.00, a leg up toward the December 16 high at 168.00 might be on the cards. The move could be denied if the Relative Strength Index (RSI) enters the oversold territory, which it’s about to happen.
The Rate of Change (RoC) suggests that the pair is peaking near the 167.00 area, with volatility shrinking towards neutral levels. Therefore, don’t discount that sellers could step in should traders’ sentiment deteriorates, which could open the door for a pullback.
If GBP/JPY drops below the April 18 daily low of 166.16, that could pave the way to test the 166.00 round number. Once cleared, a dip toward the 20-day Exponential Moving Average (EMA at 164.69 is on the cards. But some hurdles on the way south must be surpassed, like the April 14 low at 165.40, followed by the 165.00 figure.
GBP/JPY Daily Chart
Information on these pages contains forward-looking statements that involve risks and uncertainties. Markets and instruments profiled on this page are for informational purposes only and should not in any way come across as a recommendation to buy or sell in these assets. You should do your own thorough research before making any investment decisions. FXStreet does not in any way guarantee that this information is free from mistakes, errors, or material misstatements. It also does not guarantee that this information is of a timely nature. Investing in Open Markets involves a great deal of risk, including the loss of all or a portion of your investment, as well as emotional distress. All risks, losses and costs associated with investing, including total loss of principal, are your responsibility. The views and opinions expressed in this article are those of the authors and do not necessarily reflect the official policy or position of FXStreet nor its advertisers.
