EUR/USD Price Analysis: Remains above 1.0750, descending channel pattern
|
- EUR/USD tests the upper boundary to re-enter the descending channel pattern.
- If the 14-day RSI falls below the 30 level, it would signal an oversold condition.
- A return to the descending channel could lead the pair to navigate the region around channel’s lower boundary at 1.0670.
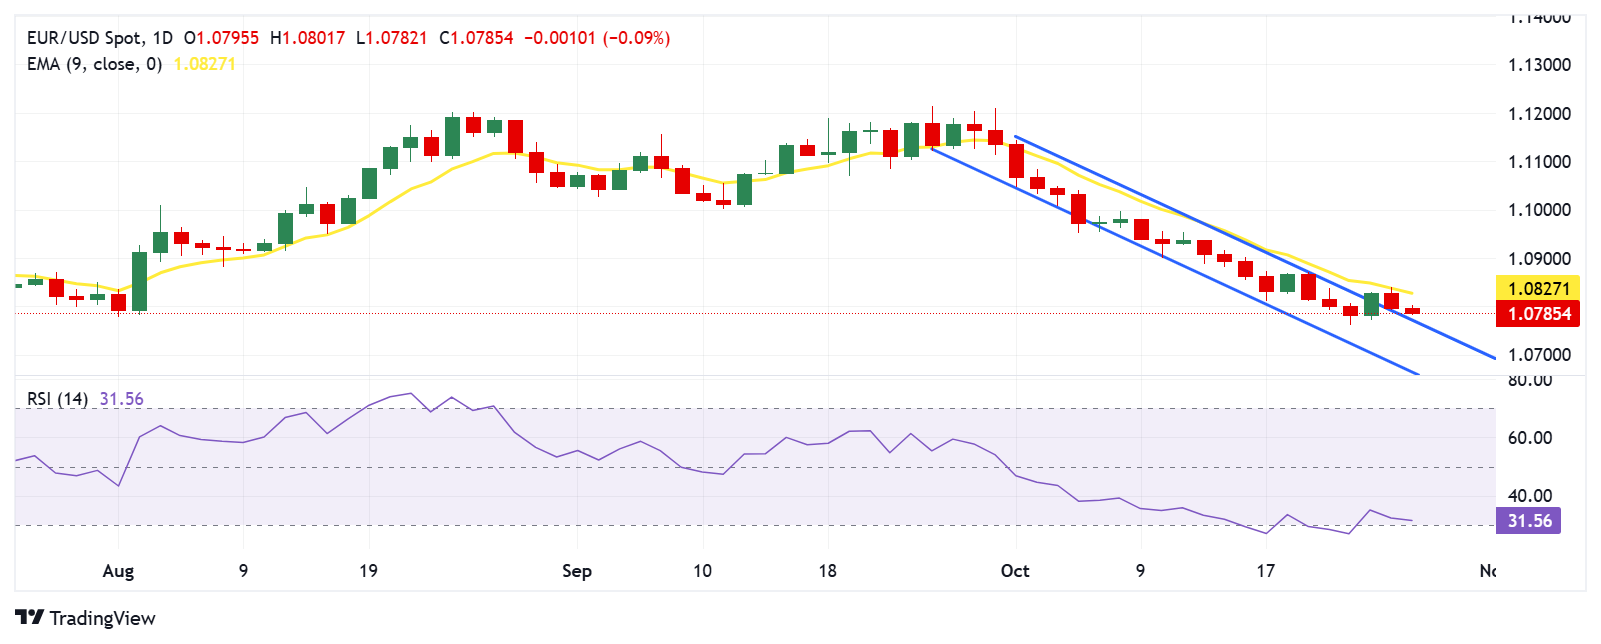
EUR/USD inches lower for the second successive day, trading around 1.0780 during the Asian session on Monday. A review of the daily chart shows that the pair tests the upper boundary to return to the descending channel pattern. which could reinforce a bearish bias for the pair.
The 14-day Relative Strength Index (RSI), a key momentum indicator, is slightly above the 30 level. A drop below this threshold would indicate an oversold condition, suggesting the possibility of an upward correction for the EUR/USD pair in the near future.
On the downside, the immediate support appears at the upper boundary of the descending channel at 1.0770 level. A return to the descending channel could put pressure on the pair to navigate the region around the psychological level of 1.0600.
A break below the psychological level of 1.0600 could increase selling pressure, pushing the pair toward testing the lower boundary of the descending channel around the 1.0670 mark.
In terms of resistance, the EUR/USD pair may encounter an immediate barrier around the nine-day Exponential Moving Average (EMA) at 1.0826, followed by the psychological level of 1.0900.
EUR/USD: Daily Chart
Euro PRICE Today
The table below shows the percentage change of Euro (EUR) against listed major currencies today. Euro was the weakest against the US Dollar.
| USD | EUR | GBP | JPY | CAD | AUD | NZD | CHF | |
|---|---|---|---|---|---|---|---|---|
| USD | 0.09% | 0.13% | 0.23% | 0.06% | 0.29% | 0.43% | 0.17% | |
| EUR | -0.09% | 0.14% | 0.08% | -0.04% | 0.27% | 0.31% | 0.10% | |
| GBP | -0.13% | -0.14% | 0.76% | -0.06% | 0.19% | 0.25% | 0.20% | |
| JPY | -0.23% | -0.08% | -0.76% | -0.11% | -0.59% | -0.58% | -0.54% | |
| CAD | -0.06% | 0.04% | 0.06% | 0.11% | 0.18% | 0.27% | 0.14% | |
| AUD | -0.29% | -0.27% | -0.19% | 0.59% | -0.18% | 0.00% | -0.17% | |
| NZD | -0.43% | -0.31% | -0.25% | 0.58% | -0.27% | -0.00% | -0.24% | |
| CHF | -0.17% | -0.10% | -0.20% | 0.54% | -0.14% | 0.17% | 0.24% |
The heat map shows percentage changes of major currencies against each other. The base currency is picked from the left column, while the quote currency is picked from the top row. For example, if you pick the Euro from the left column and move along the horizontal line to the US Dollar, the percentage change displayed in the box will represent EUR (base)/USD (quote).
Information on these pages contains forward-looking statements that involve risks and uncertainties. Markets and instruments profiled on this page are for informational purposes only and should not in any way come across as a recommendation to buy or sell in these assets. You should do your own thorough research before making any investment decisions. FXStreet does not in any way guarantee that this information is free from mistakes, errors, or material misstatements. It also does not guarantee that this information is of a timely nature. Investing in Open Markets involves a great deal of risk, including the loss of all or a portion of your investment, as well as emotional distress. All risks, losses and costs associated with investing, including total loss of principal, are your responsibility. The views and opinions expressed in this article are those of the authors and do not necessarily reflect the official policy or position of FXStreet nor its advertisers.