EUR/USD Price Analysis: Reverses recent gains to near 1.0680, Eurozone final CPI eyed
|
- EUR/USD retraces two-day gains due to market caution before the Fed decision.
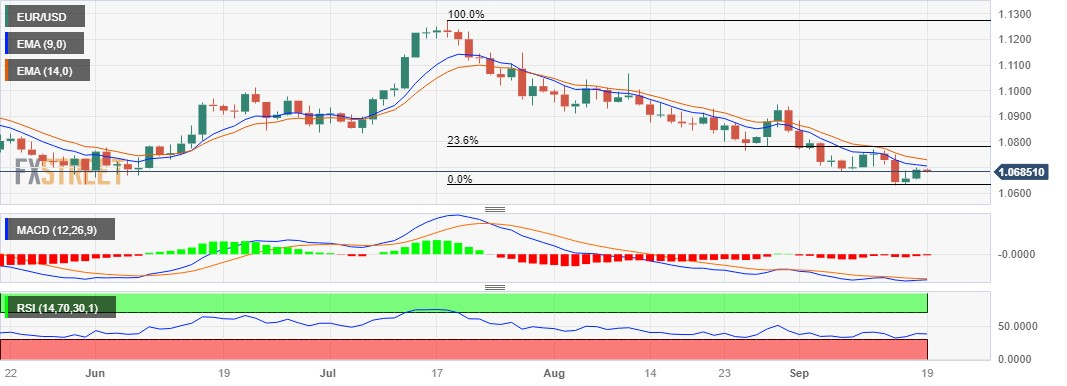
- MACD shows a pattern of convergence below the signal line; suggesting a reversal in momentum.
- The immediate support appears around 1.0650 psychological level aligned with the previous week’s low.
EUR/USD snaps the two-day winning streak, trading lower around 1.0680 during the Asian session on Tuesday. The pair is facing downward pressure due to the market caution ahead of the US Federal Reserve’s (Fed) policy decision.
The data of the Harmonized Index of Consumer Prices (HICP) and Core HICP from the Eurozone is likely to be released later in the day. Investors will observe these datasets, seeking further impetus on the economic situation in the bloc.
The immediate support for the EUR/USD pair appears around the 1.0650 psychological level, followed by the previous week’s low at 1.0631.
If bearish sentiment exerts pressure, the pair could potentially approach the next support level near the 1.0600 psychological level.
On the upside, the EUR/USD pair could face a barrier around the 1.0700 psychological level, lined up with the nine-day Exponential Moving Average (EMA) at 1.0705.
A firm break above the latter could lead the bulls to explore the region around the 14-day EMA at 1.0730, following the 23.6% Fibonacci retracement at 1.0783 level.
The Moving Average Convergence Divergence (MACD) line remains below the centerline, but it exhibits a pattern of convergence beneath the signal line. This pattern implies the potential for a reversal in momentum, indicating that the recent downtrend may be losing strength.
However, traders of the EUR/USD pair will likely observe the 14-day Relative Strength Index (RSI), which indicates bearish momentum in the short term as it lies below the 50 level.
EUR/USD: Daily Chart
Information on these pages contains forward-looking statements that involve risks and uncertainties. Markets and instruments profiled on this page are for informational purposes only and should not in any way come across as a recommendation to buy or sell in these assets. You should do your own thorough research before making any investment decisions. FXStreet does not in any way guarantee that this information is free from mistakes, errors, or material misstatements. It also does not guarantee that this information is of a timely nature. Investing in Open Markets involves a great deal of risk, including the loss of all or a portion of your investment, as well as emotional distress. All risks, losses and costs associated with investing, including total loss of principal, are your responsibility. The views and opinions expressed in this article are those of the authors and do not necessarily reflect the official policy or position of FXStreet nor its advertisers.