EUR/JPY Price Analysis: Trapped within EMAs, the short-term outlook looks sideways
|
- EUR/JPY turns bullish as it forms a double bottom and a bullish engulfing candle pattern.
- Short term, the EUR/JPY is neutrally biased, trapped within the EMAs.
- EUR/JPY Price Analysis: Bullish above 142.00; otherwise would turn downwards.
EUR/JPY rallied sharply on Monday and formed a bullish engulfing candle chart pattern. A double bottom takes shape as the EUR/JPY is poised to test solid resistance at around the 142.29-47 area. At the time of writing, the EUR/JPY is trading at 142.03.
EUR/JPY Price action
The EUR/JPY daily chart is neutral to upward biased. Nevertheless, the last few days’ price action has opened the door for further gains. Oscillators are mixed, with the Relative Strength Index (RSI) flat at bearish territory, while the Rate of Change (RoC) jumped on Monday’s trading session. Therefore, mixed signals could keep EUR/JPY traders at bay.
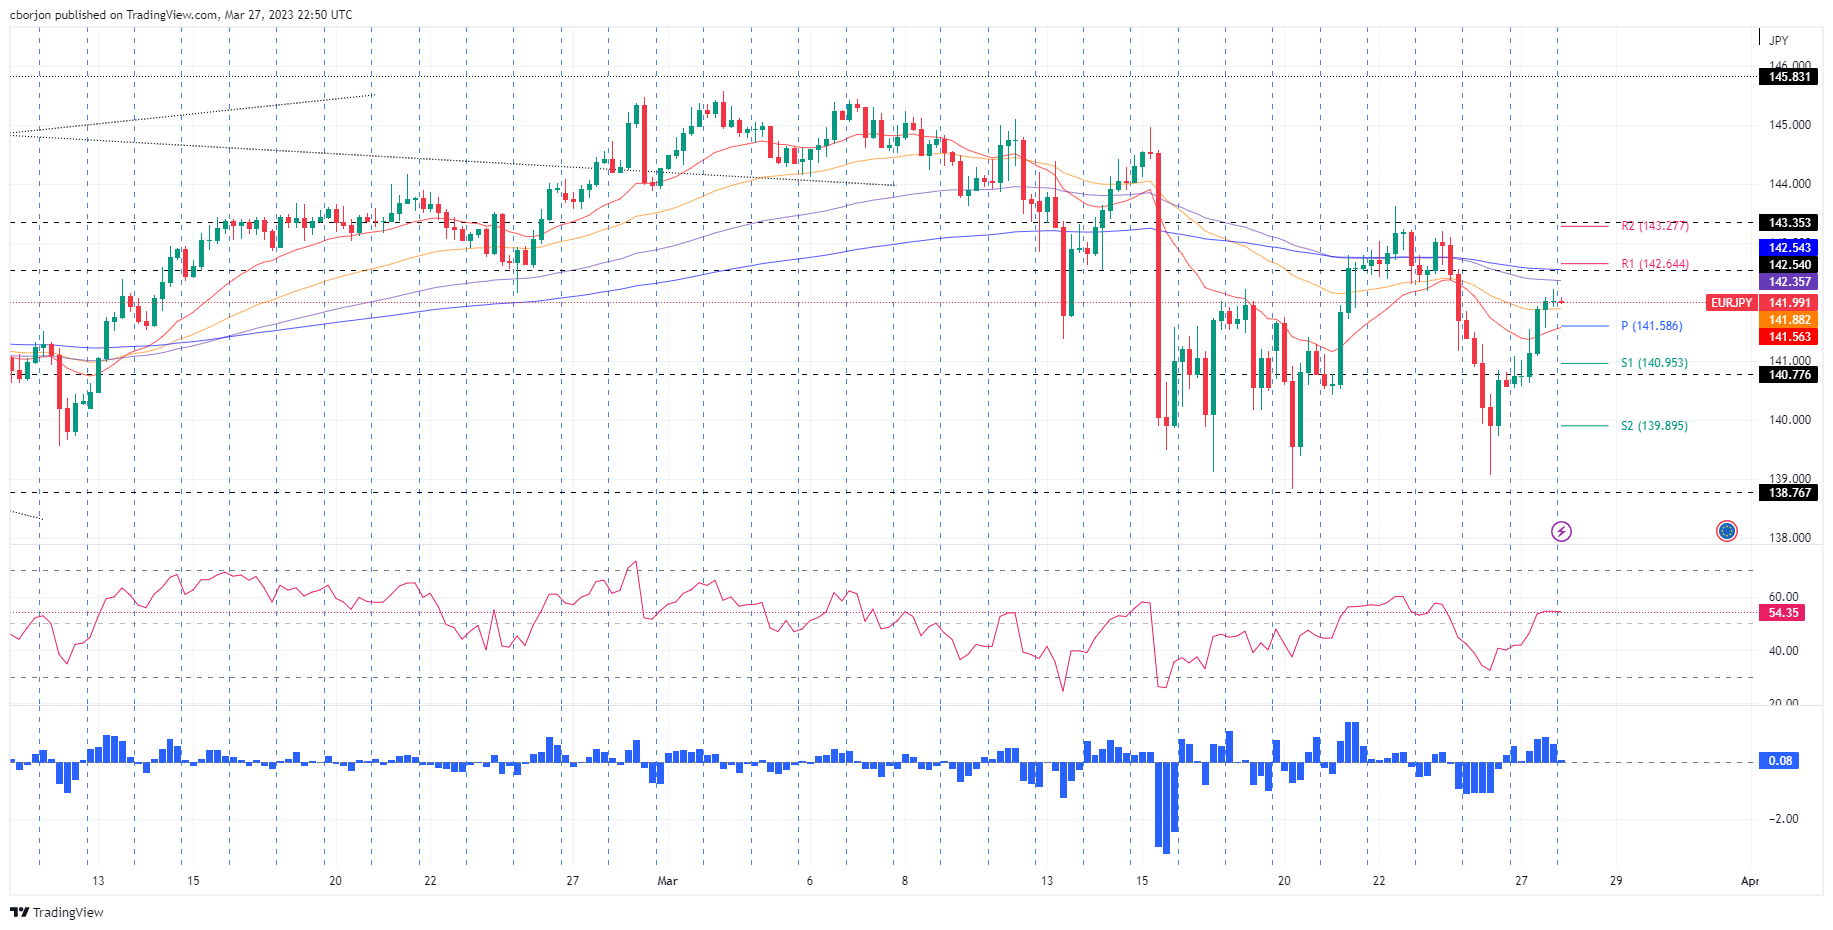
Short term, the EUR/JPY climb is pausing nearby the 142.00 mark. The EUR/JPY drew a doji, indicating that buyers/sellers are at equilibrium while oscillators remain bullish. The Relative Strength Index (RSI) at 54 turned flat, while the Rate of Change (RoC) was neutral. Therefore, the EUR/JPY might trade sideways before resuming upwards or downwards.
If the EUR/JPY cracks the 142.00 figure, the pair will test the 100-EMA at 142.35. A breach of the latter will expose the 142.54 as the pair sets to test the 143.00 mark.
On the flip side, the EUR/JPY first support would be the 50-EMA at 141.88. Once cleared, the pair would tumble to the confluence of the 20-EMA and the pivot point at 141.58 before testing 141.00.
EUR/JPY 4-hour chart
EUR/JPY Technical levels
Information on these pages contains forward-looking statements that involve risks and uncertainties. Markets and instruments profiled on this page are for informational purposes only and should not in any way come across as a recommendation to buy or sell in these assets. You should do your own thorough research before making any investment decisions. FXStreet does not in any way guarantee that this information is free from mistakes, errors, or material misstatements. It also does not guarantee that this information is of a timely nature. Investing in Open Markets involves a great deal of risk, including the loss of all or a portion of your investment, as well as emotional distress. All risks, losses and costs associated with investing, including total loss of principal, are your responsibility. The views and opinions expressed in this article are those of the authors and do not necessarily reflect the official policy or position of FXStreet nor its advertisers.
