EUR/JPY Price Analysis: The key resistance level is located near 170.00
|
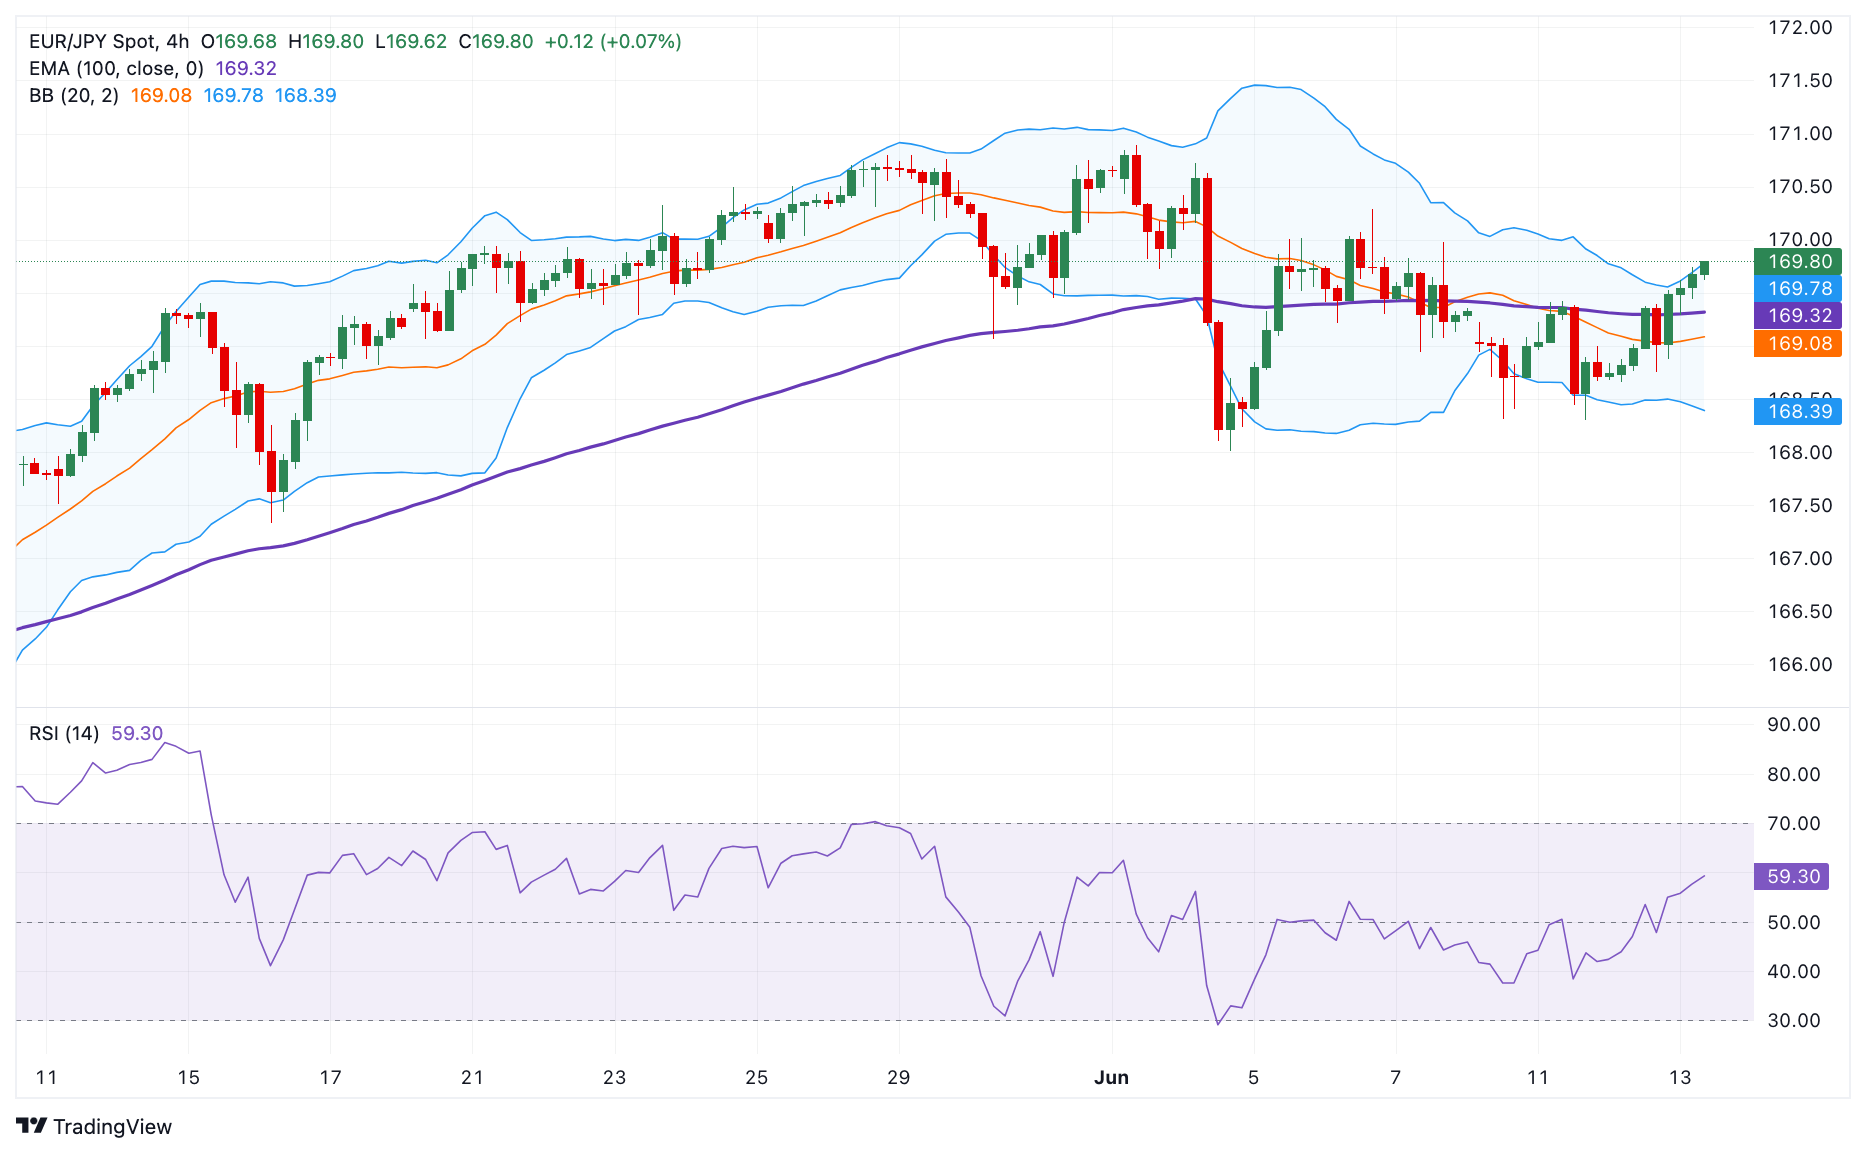
- EUR/JPY trades on a stronger note near 169.75 in Thursday’s early European session, gaining 0.22% on the day.
- The cross maintains a positive stance above the key 100-period EMA, with a bullish RSI indicator.
- The first upside barrier is seen at the 170.00 psychological mark; the initial support level is seen at 169.32.
The EUR/JPY cross gathers strength around 169.75 during the early European session on Thursday. The uncertainty that the Bank of Japan (BoJ) will announce a reduction in monthly government bond purchases amid a weaker economy continues to undermine the Japanese Yen (JPY) and create a tailwind for EUR/JPY. Market players await the Bank of Japan (BoJ) monetary policy meeting on Friday, which is widely expected to leave interest rates unchanged.
According to the 4-hour chart, EUR/JPY keeps the bullish vibe unchanged as the cross is above the key 100-period Exponential Moving Averages (EMA). The upward momentum is supported by the Relative Strength Index (RSI), which stands in bullish territory near 58.0, supporting the buyers for the time being.
A decisive break above 169.75, the upper boundary of Bollinger Band, will attract some buyers to the 170.00 psychological level. Further north, the additional upside filter to watch is 170.85, a high of June 3, en route to an all-time high of 171.60.
On the downside, the initial support level is located at 169.32, the 100-period EMA. A breach of the mentioned level could pave the way to 168.75, a low of June 12. Extended losses will see a drop to 168.40, the lower limit of Bollinger Band.
EUR/JPY 4-hour chart
Information on these pages contains forward-looking statements that involve risks and uncertainties. Markets and instruments profiled on this page are for informational purposes only and should not in any way come across as a recommendation to buy or sell in these assets. You should do your own thorough research before making any investment decisions. FXStreet does not in any way guarantee that this information is free from mistakes, errors, or material misstatements. It also does not guarantee that this information is of a timely nature. Investing in Open Markets involves a great deal of risk, including the loss of all or a portion of your investment, as well as emotional distress. All risks, losses and costs associated with investing, including total loss of principal, are your responsibility. The views and opinions expressed in this article are those of the authors and do not necessarily reflect the official policy or position of FXStreet nor its advertisers.