EUR/JPY Price Analysis: Climbs above 147.00, refreshing 8-year highs, as buyers target 150.00
|
- EUR/JPY printed a fresh YTD high above 147.00 as buyers eye December’s 2014 high.
- A risk-on impulse keeps safe-haven currencies, like the yen, on the defensive.
- EUR/JPY Price Analysis: Negative divergence in the daily and hourly charts to pave the way for a correction towards 145.00.
The EUR/JPY continues extending its gains, eyeing December’s 2013 high of 149.78, while the Japanese yen continues to weaken, despite further verbal interventions by Japanese authorities, which have failed to move the markets in favor of the battered yen. At the time of writing, the EUR/JPY is trading at 147.04. shy of the YTD high of 147.12.
Sentiment-wise, investors’ mood is upbeat, as portrayed by European bourses closing in the green, while US stocks followed suit. Therefore, safe-haven currencies like the Japanese yen, and the Swiss franc, would remain the weakest links in favor of other G8 currencies.
EUR/JPY Price Analysis
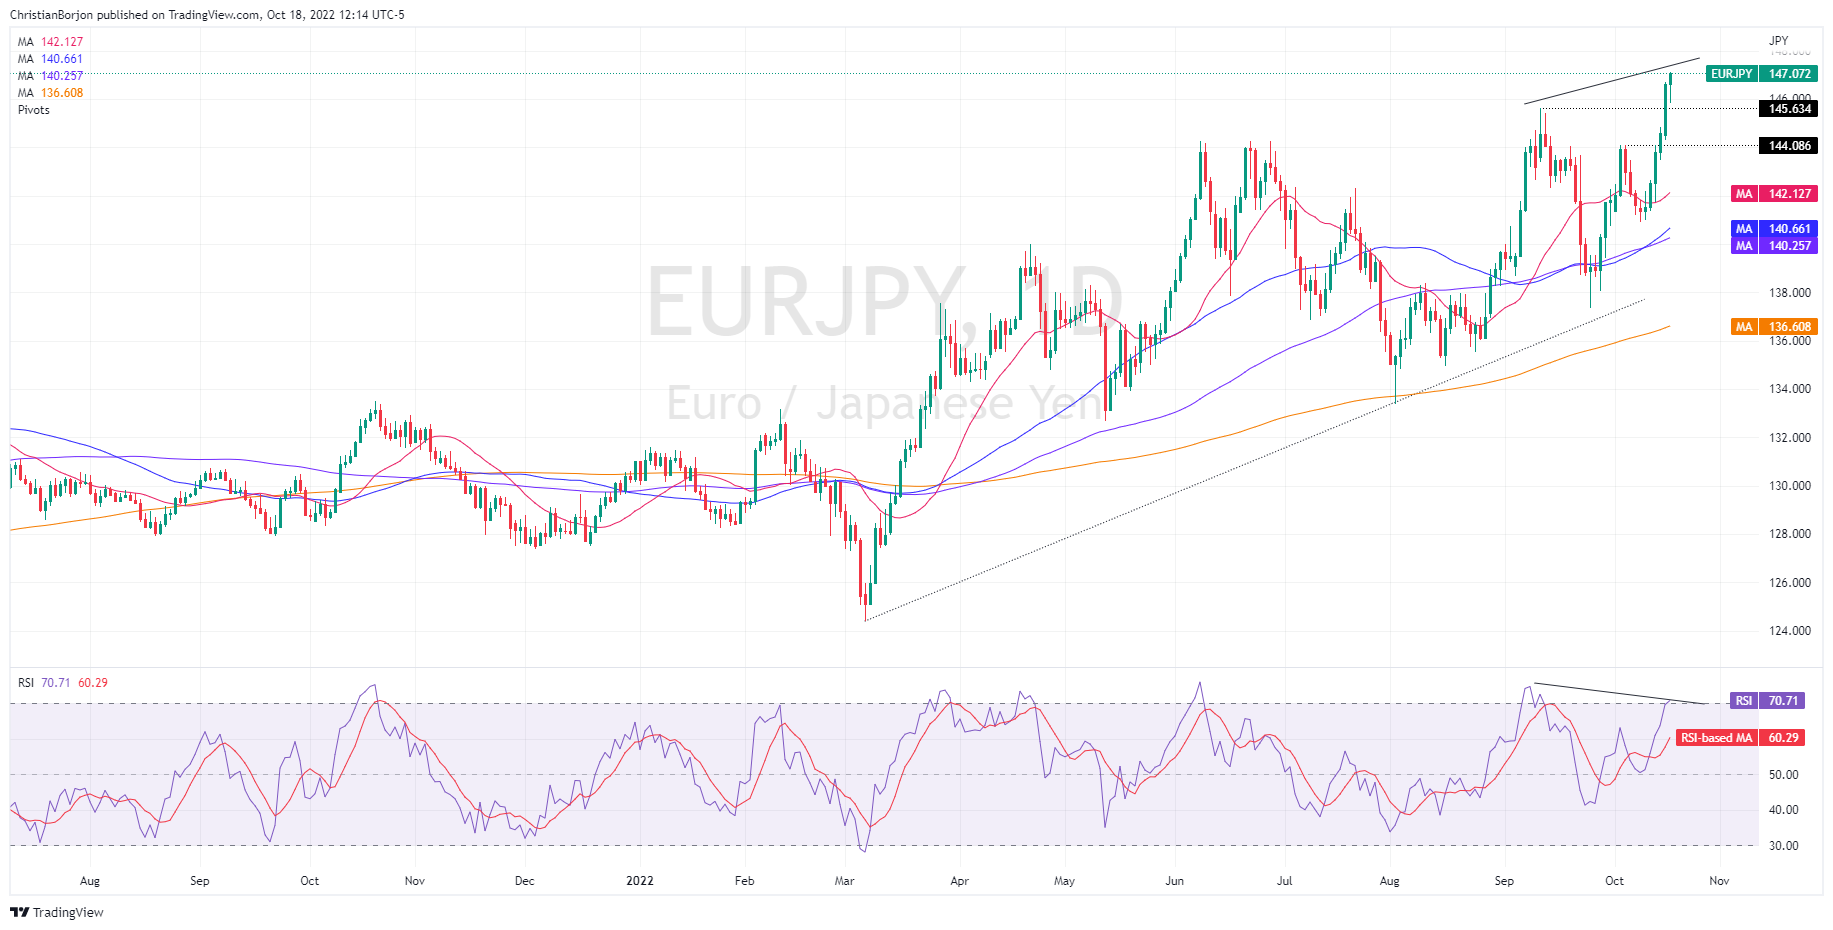
The daily chart shows that the EUR/JPY is upward biased. On Monday, the cross-currency pair broke into fresh eight-year highs and, earlier in the North American session, reached a YTD high at 147.12. Of note is that as the EUR/JPY climbs, registering higher highs, the Relative Strength Index (RSI) didn’t, so a negative divergence between RSI and price action could pave the way for a mean-reversion move before continuing to rally.
Hence, the EUR/JPY first support would be the September 12 daily high at 145.63. Break below will expose the October 5 cycle high-turned-support at 144.08, ahead of the 20-day EMA at 142.12.
EUR/JPY Daily chart
In the near term, the EUR/JPY one-hour chart shows price action as overextended, registering higher highs, while the RSI prints lower highs, as in the daily chart. Therefore, a negative divergence surfaced, opening the door for a correction.
Therefore, the EUR/JPY first support would be the 20-EMA at 14.70, which, once cleared, would expose a busy area, with the confluence of the daily low, the 50-EMA, and the central pivot point at around 145.84. A breach of the latter will expose the S1 pivot at around 145.00.
EUR/JPY Hourly chart
EUR/JPY Key Technical Levels
Information on these pages contains forward-looking statements that involve risks and uncertainties. Markets and instruments profiled on this page are for informational purposes only and should not in any way come across as a recommendation to buy or sell in these assets. You should do your own thorough research before making any investment decisions. FXStreet does not in any way guarantee that this information is free from mistakes, errors, or material misstatements. It also does not guarantee that this information is of a timely nature. Investing in Open Markets involves a great deal of risk, including the loss of all or a portion of your investment, as well as emotional distress. All risks, losses and costs associated with investing, including total loss of principal, are your responsibility. The views and opinions expressed in this article are those of the authors and do not necessarily reflect the official policy or position of FXStreet nor its advertisers.
