EUR/GBP Price Analysis: Bulls flex their muscles and threaten the 200-day SMA
|
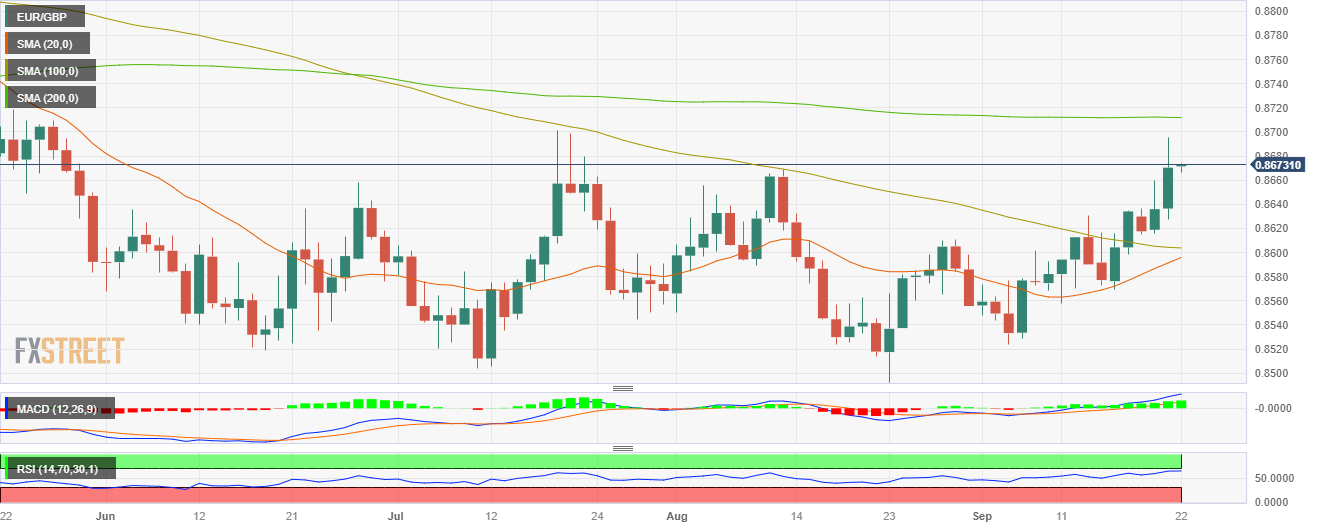
- EUR/GBP closed Thursday at 0.8670, up by 0.20%, hitting a daily high of 0.8695 near the 200-day SMA.
- The daily and four-hour chart flashes bullish signals.
- The 20-day SMA and 100-day SMA are about to perform a bullish cross on the daily chart.
On Thursday, the EUR/GBP cross gained further momentum, closing towards the 0.8670 area, and has already gained 1.34% in September.
In line with that, the daily chart indicates that the technical outlook favours the bulls over the bears. The Relative Strength Index (RSI) and Moving Average Convergence Divergence (MACD) are comfortably placed on the daily chart in positive territory. Moreover, the pair is above the 20 and 100-day Simple Moving Averages (SMAs), but below the 200-day SMA, suggesting that the bears struggle to challenge the overall bullish trend. Traders should eye the convergence of the 20 and 100-day averages towards the 0.8600 area, which seems to be about to perform a bullish cross, which could boost the buying impulse.
On the four-hour chart, technical indicators also point to a clear dominance of the bulls, with the RSI printing a slight upward slope near the 70 threshold while the MACD displays flat green bars.
Support Levels: 0.8630, 0.8600 (20 and 100-day SMA convergence), 0.8570.
Resistance Levels: 0.8700, 0.8710 (200-day SMA), 0.8750.
EUR/GBP Daily chart
Information on these pages contains forward-looking statements that involve risks and uncertainties. Markets and instruments profiled on this page are for informational purposes only and should not in any way come across as a recommendation to buy or sell in these assets. You should do your own thorough research before making any investment decisions. FXStreet does not in any way guarantee that this information is free from mistakes, errors, or material misstatements. It also does not guarantee that this information is of a timely nature. Investing in Open Markets involves a great deal of risk, including the loss of all or a portion of your investment, as well as emotional distress. All risks, losses and costs associated with investing, including total loss of principal, are your responsibility. The views and opinions expressed in this article are those of the authors and do not necessarily reflect the official policy or position of FXStreet nor its advertisers.