Dow Jones Industrial Average sheds nearly 200 points in Thursday pullback
|
- The Dow Jones shed a little under 200 points on Thursday as investors blink.
- US PMI figures came in mixed, with Services up but Manufacturing down.
- Investors await further signs of Fed rate cuts.
The Dow Jones Industrial Average (DJIA) shed some weight on Thursday, easing back around 200 points after a misfire in US Purchasing Managers Index (PMI) figures gave investors a reason to pause. US PMI prints further highlighted a softening in the US labor market, sending jitters through markets, which continue to bet that a Federal Reserve (Fed) rate cut in September will solve all of their problems.
US Manufacturing PMI figures tumbled back to 48.0 in August, well below the forecast steady print of 49.6. The US Services PMI unexpectedly tick upwards to 55.2 from 55.0 compared to the forecast decline to 48.0. Despite the upswing in Services PMI numbers, underlying employment figures continue to show a shortening in the US labor market, adding to concerns that were mostly ignored when the US Bureau of Labor Statistics retroactively wiped over 800K jobs from March’s Nonfarm Payrolls (NFP) print this week.
Markets continue to pine for a September cut, but Thursday’s PMI data sparked a pullback from a recent upswing into bets that the Fed would cut 50 bps on September 18. Rate markets have pulled back to a healthier overall expectation of a single quarter-point cut in September, pricing in around 75% odds of a 25 bps rate trim.
The Jackson Hole Economic Symposium is underway in Wyoming today, and investors will be looking ahead to Friday’s expected appearance from Fed Chairman Jerome Powell. Markets are hoping that the Fed head will introduce firmer guidance on how likely the Fed is to cut in September, as well as for how much.
Dow Jones news
The Dow Jones index is easing slightly lower on Thursday, with roughly two-thirds of the index declining on the day. Losses were led by Intel Corp. (INTC), which fell another 6.12% to $20.10 per share. Gains were notably limited on Thursday, with the top of the board claimed by JPMorgan Chase & Co. (JPM), which broke head of the pack late in the day to rise 0.95% to $216.63.
Dow Jones Price Forecast
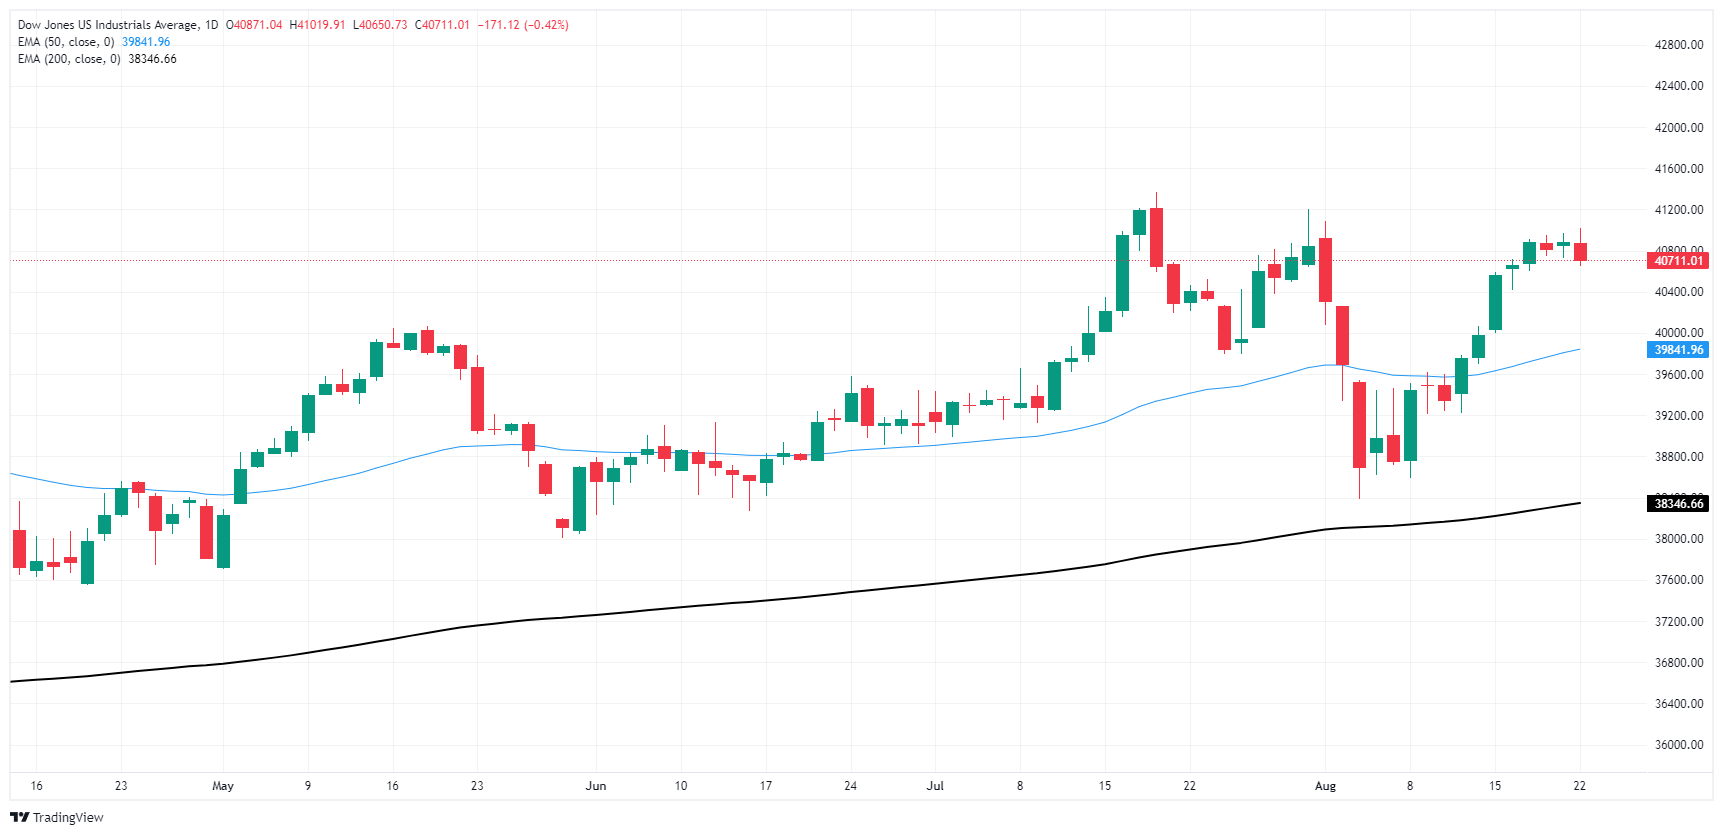
With the Dow Jones pulling back, there is a building risk that a bearish correction could kick off with topside momentum running out of gas just below all-time highs set in July. The Dow Jones’ recent recovery is set to take a breather and give short pressure a chance to drag price action back down to the 50-day Exponential Moving Average (EMA) at 39,481.00.
Dow Jones daily chart

Dow Jones FAQs
The Dow Jones Industrial Average, one of the oldest stock market indices in the world, is compiled of the 30 most traded stocks in the US. The index is price-weighted rather than weighted by capitalization. It is calculated by summing the prices of the constituent stocks and dividing them by a factor, currently 0.152. The index was founded by Charles Dow, who also founded the Wall Street Journal. In later years it has been criticized for not being broadly representative enough because it only tracks 30 conglomerates, unlike broader indices such as the S&P 500.
Many different factors drive the Dow Jones Industrial Average (DJIA). The aggregate performance of the component companies revealed in quarterly company earnings reports is the main one. US and global macroeconomic data also contributes as it impacts on investor sentiment. The level of interest rates, set by the Federal Reserve (Fed), also influences the DJIA as it affects the cost of credit, on which many corporations are heavily reliant. Therefore, inflation can be a major driver as well as other metrics which impact the Fed decisions.
Dow Theory is a method for identifying the primary trend of the stock market developed by Charles Dow. A key step is to compare the direction of the Dow Jones Industrial Average (DJIA) and the Dow Jones Transportation Average (DJTA) and only follow trends where both are moving in the same direction. Volume is a confirmatory criteria. The theory uses elements of peak and trough analysis. Dow’s theory posits three trend phases: accumulation, when smart money starts buying or selling; public participation, when the wider public joins in; and distribution, when the smart money exits.
There are a number of ways to trade the DJIA. One is to use ETFs which allow investors to trade the DJIA as a single security, rather than having to buy shares in all 30 constituent companies. A leading example is the SPDR Dow Jones Industrial Average ETF (DIA). DJIA futures contracts enable traders to speculate on the future value of the index and Options provide the right, but not the obligation, to buy or sell the index at a predetermined price in the future. Mutual funds enable investors to buy a share of a diversified portfolio of DJIA stocks thus providing exposure to the overall index.
Economic Indicator
S&P Global Manufacturing PMI
The S&P Global Manufacturing Purchasing Managers Index (PMI), released on a monthly basis, is a leading indicator gauging business activity in the US manufacturing sector. The data is derived from surveys of senior executives at private-sector companies from the manufacturing sector. Survey responses reflect the change, if any, in the current month compared to the previous month and can anticipate changing trends in official data series such as Gross Domestic Product (GDP), industrial production, employment and inflation. A reading above 50 indicates that the manufacturing economy is generally expanding, a bullish sign for the US Dollar (USD). Meanwhile, a reading below 50 signals that activity in the manufacturing sector is generally declining, which is seen as bearish for USD.
Read more.Last release: Thu Aug 22, 2024 13:45 (Prel)
Frequency: Monthly
Actual: 48
Consensus: 49.6
Previous: 49.6
Source: S&P Global
Information on these pages contains forward-looking statements that involve risks and uncertainties. Markets and instruments profiled on this page are for informational purposes only and should not in any way come across as a recommendation to buy or sell in these assets. You should do your own thorough research before making any investment decisions. FXStreet does not in any way guarantee that this information is free from mistakes, errors, or material misstatements. It also does not guarantee that this information is of a timely nature. Investing in Open Markets involves a great deal of risk, including the loss of all or a portion of your investment, as well as emotional distress. All risks, losses and costs associated with investing, including total loss of principal, are your responsibility. The views and opinions expressed in this article are those of the authors and do not necessarily reflect the official policy or position of FXStreet nor its advertisers.