Crude Oil slumps despite surprise drawdown in US barrel counts, WTI back into $72
|
- WTI declined on Thursday, extending losses as broad-market risk flows reverse direction.
- Crude Oil markets are facing declines, shrugging off an unexpected decline in US crude stocks.
- Rough year-end markets are pulling down barrel prices to close out 2023.
West Texas Intermediate (WTI) US Crude Oil extended a decline on Thursday, backsliding into the low end and testing below the $72 handle as market risk appetite sours following a surprise jump in US Treasury yields, and shrugging off a surprise decline in US crude stocks.
According to figures from the Energy Information Administration (EIA), US barrel counts declined an unexpected -6.9 million barrels for the week ended December 22, far below the forecast 2.7 million decline and eating away at the previous week’s 2.9 million barrel buildup.
Red Sea tensions have begun to recede as logistics return to the region. Tensions mounted after Iran-backed Houthi rebels in Yemen began attacking logistics ships passing through the Red Sea, but a coalition naval force has descended on the region to allow ships to resume passing through the critical supply line between Europe and Asia.
2023’s production clampdown by the Organization of the Petroleum Exporting Countries (OPEC) failed to spark a long-term bull run in Crude Oil bids, as several smaller member states snub the oil cartel’s voluntary production caps, sparking the departure of Angola from the oil organization’s ranks. Despite key member states dedicated to ongoing production cuts, most notably Saudi Arabia extending over a million barrels per day in pumping reductions, Crude Oil production continues to outpace global oil demand.
WTI Technical Levels
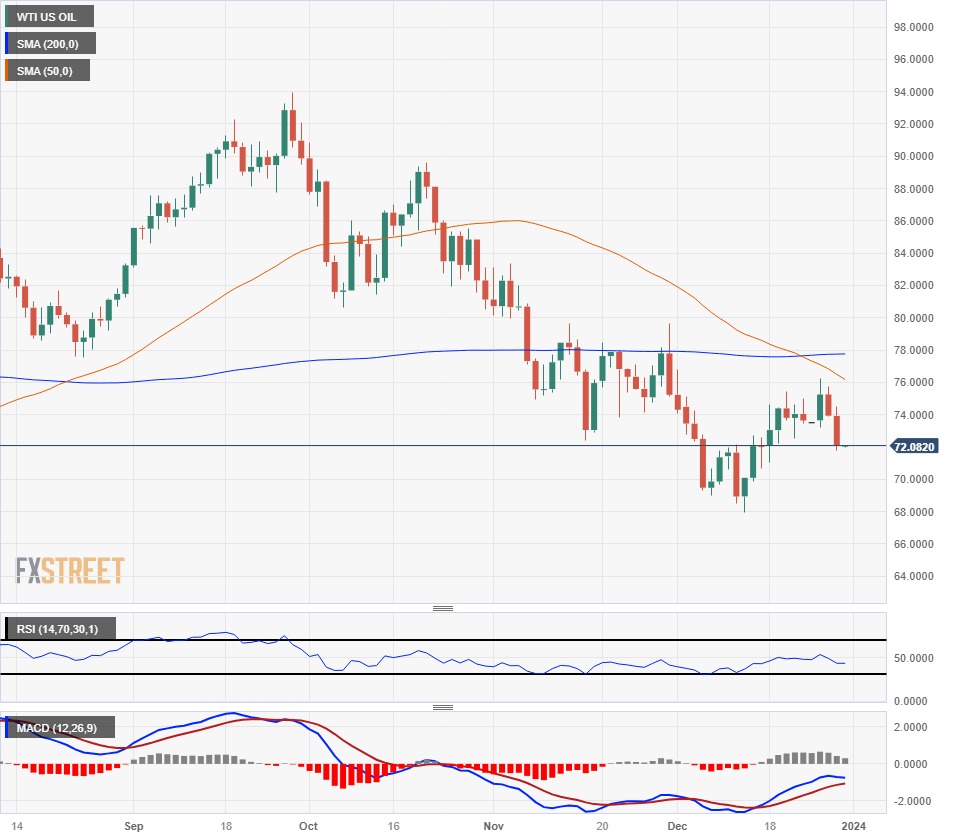
Intraday US Crude Oil action has dragged WTI down through the 200-day Simple Moving Average (SMA) near $73.75, descending to re-test chart territory below the $72 handle.
WTI has declined nearly 6% from the week’s high near $76.20, marking in a lower high on the daily candlesticks and pricing in a new technical ceiling while the 50-day SMA accelerates into the low side of the 200-day SMA after confirming a bearish cross.
WTI Daily Chart

WTI Technical Levels
Information on these pages contains forward-looking statements that involve risks and uncertainties. Markets and instruments profiled on this page are for informational purposes only and should not in any way come across as a recommendation to buy or sell in these assets. You should do your own thorough research before making any investment decisions. FXStreet does not in any way guarantee that this information is free from mistakes, errors, or material misstatements. It also does not guarantee that this information is of a timely nature. Investing in Open Markets involves a great deal of risk, including the loss of all or a portion of your investment, as well as emotional distress. All risks, losses and costs associated with investing, including total loss of principal, are your responsibility. The views and opinions expressed in this article are those of the authors and do not necessarily reflect the official policy or position of FXStreet nor its advertisers.