Crude Oil continues to soften on Middle East ceasefire talks, WTI falls to $78
|
- WTI softened further, extended backslide to $78 per barrel.
- Ceasefire talks drag down Crude Oil bets.
- US Crude Oil production remains thorn in barrel market’s side.
West Texas Intermediate (WTI) US Crude Oil futures fell on Monday after headlines of a possible ceasefire in the ongoing conflict between Israel and Palestinian Hamas. Crude Oil markets will also be keeping an eye out for weekly production updates from the US as output threatens to outpace demand.
Details are still forthcoming, but negotiations between Israel and Hamas have tilted towards a resolution, dragging down barrel bids that have spent months churning higher on broad-market concerns of a conflict spilling over into neighboring countries and threatening global Crude Oil markets.
Weekly production updates from the American Petroleum Institute (API) and Energy Information Administration (EIA) will be closely watched by Crude Oil markets this week. US Crude Oil production has edged into higher territory in recent weeks, and supply is slowly beginning to outstrip demand. With week-on-week barrel counts slowly building out inventories beyond what demand is able to sop up, energy markets will be looking for a pull down in US production figures.
WTI technical outlook
WTI US Crude Oil is seeing market churn near $78.50 as markets grapple with a potential ceasefire deal on the cards, and barrel bids are pricing in a near-term price floor around the $78.00 price handle.
Recent bearish sentiment in Crude Oil has sent WTI further down from the 200-hour Exponential Moving Average (EMA) at $80.43, and US Crude Oil prices are down 3% in May.
WTI has closed in the red for six consecutive trading sessions, dipping below the 200-day EMA at $79.36. An extended decline will drag barrel prices down to February’s swing low near $72.00 per barrel, while the upside will be capped at the last turnaround near $84.00.
WTI hourly chart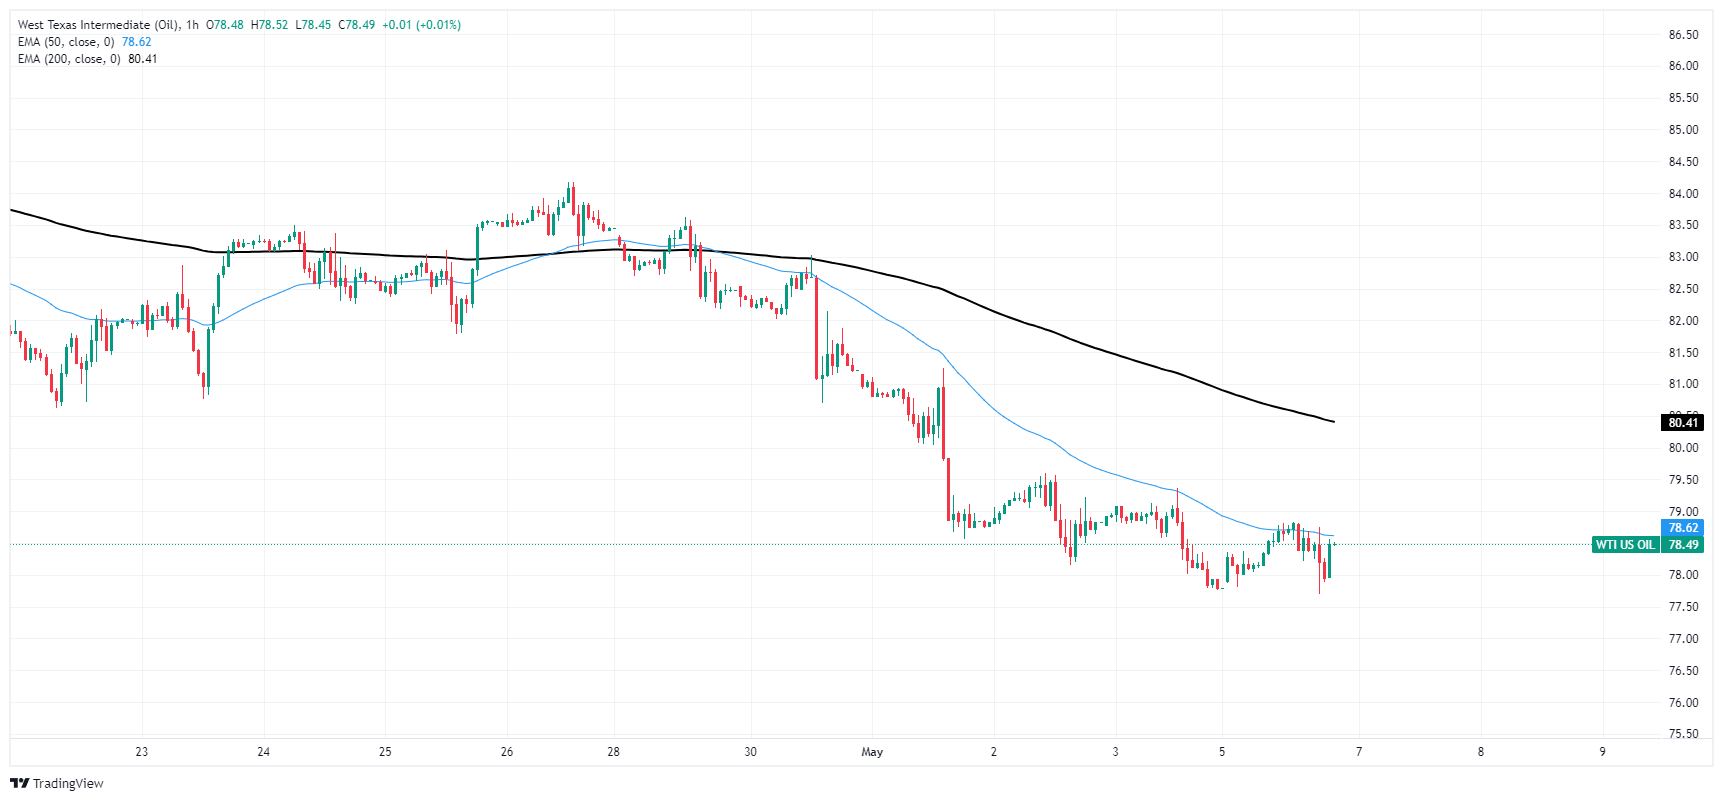
WTI daily chart
Information on these pages contains forward-looking statements that involve risks and uncertainties. Markets and instruments profiled on this page are for informational purposes only and should not in any way come across as a recommendation to buy or sell in these assets. You should do your own thorough research before making any investment decisions. FXStreet does not in any way guarantee that this information is free from mistakes, errors, or material misstatements. It also does not guarantee that this information is of a timely nature. Investing in Open Markets involves a great deal of risk, including the loss of all or a portion of your investment, as well as emotional distress. All risks, losses and costs associated with investing, including total loss of principal, are your responsibility. The views and opinions expressed in this article are those of the authors and do not necessarily reflect the official policy or position of FXStreet nor its advertisers.