Crude Oil climbs, WTI rises into $75.50 after EIA reports US crude supply drawdown
|
- Energy markets bid up Crude Oil after US supplies declined more than expected.
- EIA reported a steep drawdown in US crude stocks, but another buildup in refined gasoline.
- Cold weather hampered Crude oil logistics, China stimulus expected to drive demand higher.
Crude Oil markets climbed on Wednesday, sending West Texas Intermediate (WTI) into its highest bids in almost six weeks after the Energy Information Administration (EIA) revealed a steeper-than-expected drawdown in US barrel supplies.
China is expected to add additional stimulus to the domestic Chinese economy and reduce the reserve requirements for local banks in an effort to jumpstart flagging business activity. Barrel traders expect the additional business spending to pump up demand for Crude Oil in China.
The EIA reported a surprise drawdown of over 9 million barrels of US Crude Oil Inventories, owing in large part to a recent cold snap that limited logistics and deliveries in several key areas. Despite the drawdown in Crude Oil supplies, energies are shrugging off another surprise buildup in gasoline inventories of 4.913 million barrels of refined gasoline versus the forecast 2 million barrel buildup, adding even further to the previous week’s 3.083 million barrels.
Canada's Trans Mountain pipeline expansion is nearing completion, with the pipeline expected to begin backfilling sometime in February. The pipeline is expected to triple Canada's output of Crude Oil to global markets by the end of the summer season, according to company officials. Canada currently stands as the fourth-largest producer of Crude Oil in the world.
WTI Technical Outlook
WTI Crude Oil climbed above $75.50, setting an intraday high of $75.80 before slipping back to continue testing just above the $75.00 handle. US Crude Oil continues to find technical support from the 200-hour Simple Moving Average (SMA) near $73.50, and near-term technical continue to lean bullish.
Daily candlesticks show a possible technical ceiling at the 200-day SMA near the $78.00 handle as WTI drifts into a congestion zone between the 200-day SMA and a bearish 50-day SMA just below $74.00.
WTI Hourly Chart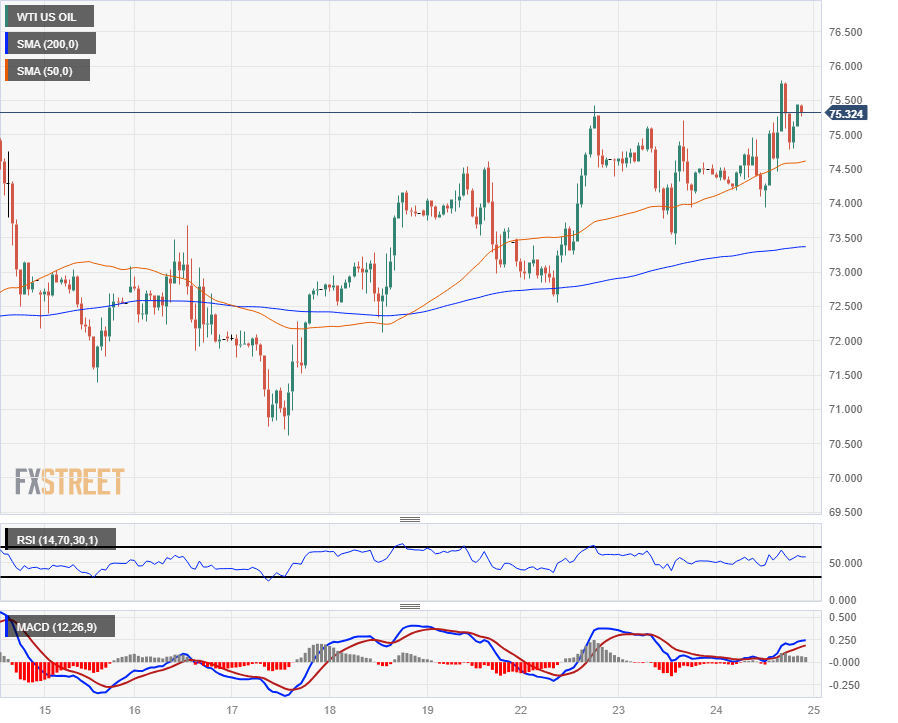
WTI Daily Chart
Information on these pages contains forward-looking statements that involve risks and uncertainties. Markets and instruments profiled on this page are for informational purposes only and should not in any way come across as a recommendation to buy or sell in these assets. You should do your own thorough research before making any investment decisions. FXStreet does not in any way guarantee that this information is free from mistakes, errors, or material misstatements. It also does not guarantee that this information is of a timely nature. Investing in Open Markets involves a great deal of risk, including the loss of all or a portion of your investment, as well as emotional distress. All risks, losses and costs associated with investing, including total loss of principal, are your responsibility. The views and opinions expressed in this article are those of the authors and do not necessarily reflect the official policy or position of FXStreet nor its advertisers.