AUD/USD Price Prediction: Looks to build on move beyond 200-day SMA/0.6600 ahead of US PPI
|
- AUD/USD prolongs its one-week-old uptrend and climbs to a three-week top on Tuesday.
- The RBA’s hawkish tilt remains supportive amid subdued USD demand ahead of US PPI.
- The technical setup favors bulls and supports prospects for a further appreciating move.
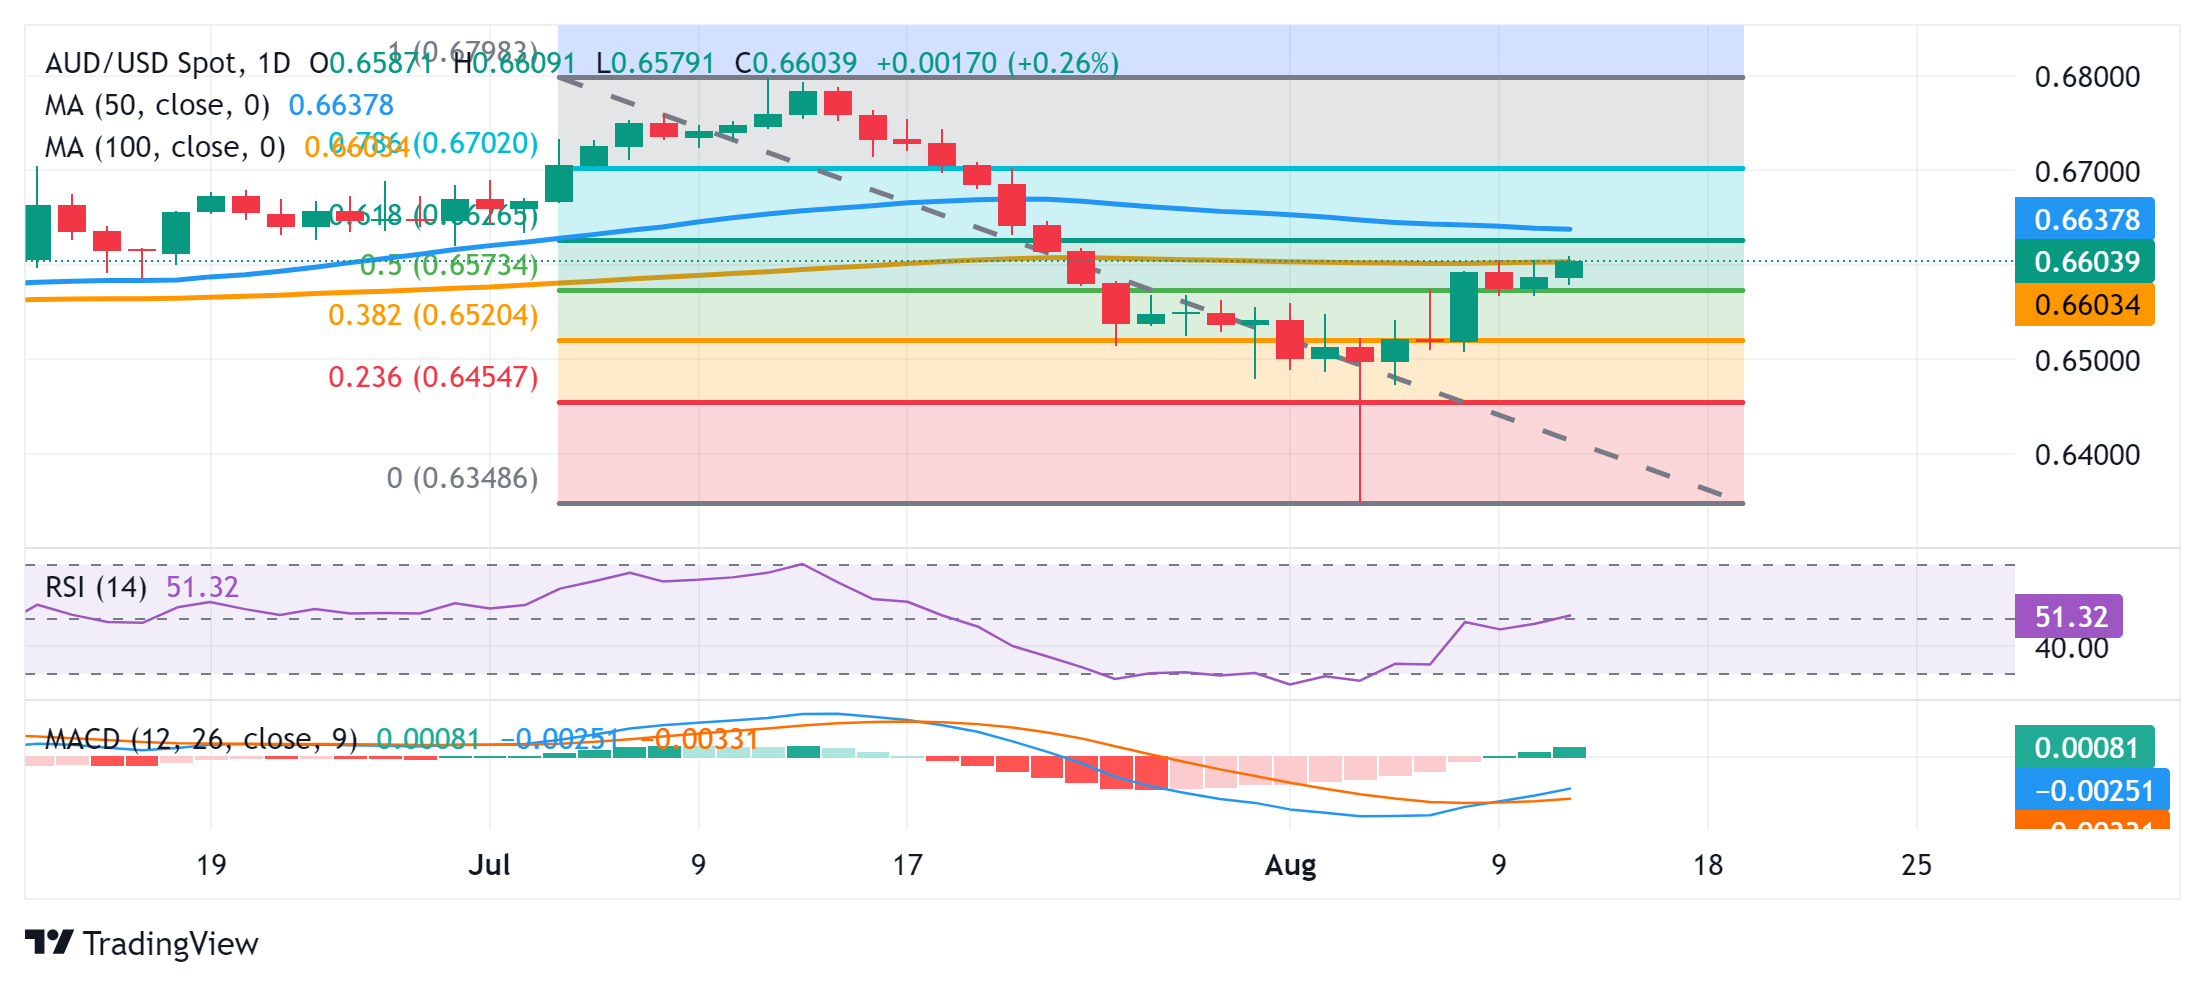
The AUD/USD pair attracts some follow-through buying for the second successive day on Tuesday and climbs to a fresh three-week top during the early part of the European session. Spot prices currently trade around the 0.6600 mark, with bulls looking to build on the momentum beyond the very important 200-day Simple Moving Average (SMA) resistance.
Against the backdrop of the Reserve Bank of Australia's (RBA) hawkish stance, a stable performance across the global equity markets is seen lending some support to the risk-sensitive Australian Dollar (AUD). The US Dollar (USD), on the other hand, struggles to gain any meaningful traction amid expectations for bigger interest rate cuts by the Federal Reserve (Fed). This turns out to be another factor acting as a tailwind for the AUD/USD pair, though the upside potential seems limited ahead of the crucial US inflation figures.
From a technical perspective, sustained strength and acceptance beyond the 200-day SMA hurdle would be seen as a fresh trigger for bullish traders and pave the way for a further appreciating move. Given that oscillators on the daily chart have just started moving in positive territory, the AUD/USD pair might then climb to the 0.6655 intermediate hurdle en route to the 0.6675-0.6680 region and the 0.6700 mark. The latter coincides with the 78.6% Fibonacci retracement level of the July-August fall and should act as a pivotal point.
On the flip side, the 0.6575-0.6570 area, or the 50% Fibo. level now seems to have emerged as an immediate support. This is followed by support near the 0.6545 horizontal zone, the 38.2% Fibo. level near the 0.6520 region, and the 0.6500 psychological mark. Some follow-through buying will suggest that the latest recovery move from the YTD low has run its course and drag the AUD/USD pair to the 0.6435 intermediate support en route to the 0.6400 mark and last week's swing low, around the 0.6350-0.6345 region.
AUD/USD daily chart
Economic Indicator
Producer Price Index (YoY)
The Producer Price Index released by the Bureau of Labor statistics, Department of Labor measures the average changes in prices in primary markets of the US by producers of commodities in all states of processing. Changes in the PPI are widely followed as an indicator of commodity inflation. Generally speaking, a high reading is seen as positive (or bullish) for the USD, whereas a low reading is seen as negative (or bearish).
Read more.Next release: Tue Aug 13, 2024 12:30
Frequency: Monthly
Consensus: 2.3%
Previous: 2.6%
Source: US Bureau of Labor Statistics
Information on these pages contains forward-looking statements that involve risks and uncertainties. Markets and instruments profiled on this page are for informational purposes only and should not in any way come across as a recommendation to buy or sell in these assets. You should do your own thorough research before making any investment decisions. FXStreet does not in any way guarantee that this information is free from mistakes, errors, or material misstatements. It also does not guarantee that this information is of a timely nature. Investing in Open Markets involves a great deal of risk, including the loss of all or a portion of your investment, as well as emotional distress. All risks, losses and costs associated with investing, including total loss of principal, are your responsibility. The views and opinions expressed in this article are those of the authors and do not necessarily reflect the official policy or position of FXStreet nor its advertisers.