AUD/USD Price Analysis: Struggles within 2.5-month-old bullish channel, 0.6600 is crucial for Aussie bears
|
- AUD/USD fails to extend the corrective bounce off multi-day low inside ascending trend channel.
- Short-term falling resistance line prods recovery moves.
- Below-50 levels of RSI suggests bottom picking inside bullish chart formation.
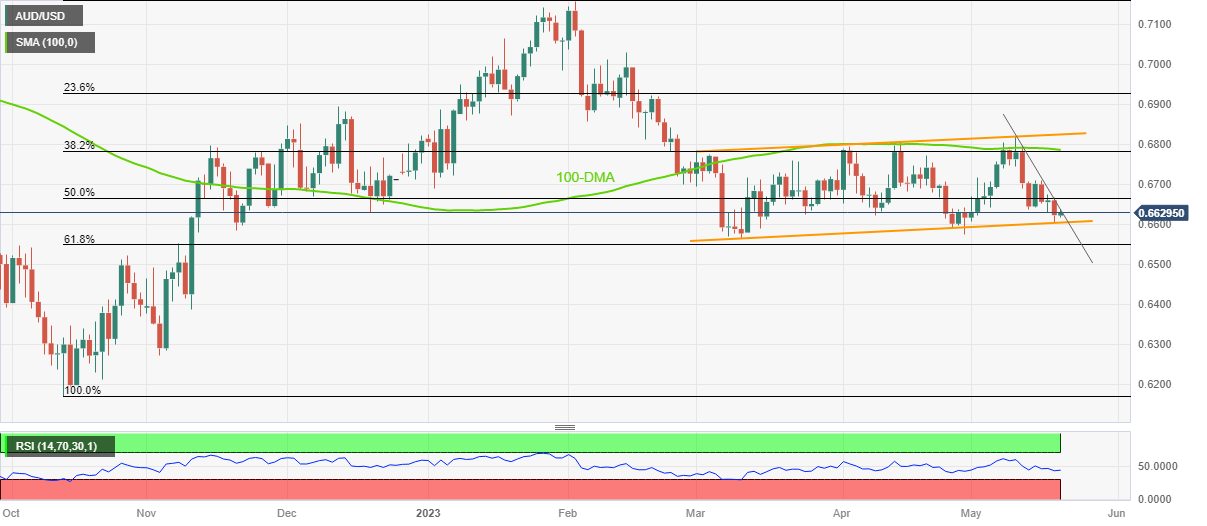
AUD/USD stays defensive near 0.6630 despite picking up bids during early Friday as it jostles with a one-week-old descending resistance line within a rising trend channel established since March.
It’s worth noting that the Aussie pair dropped to the lowest levels in three weeks the previous day amid broad US Dollar strength but the greenback’s retreat ahead of the top-tier events triggered the AUD/USD rebound from the lower line of a 2.5-month-old bullish channel.
Adding strength to the corrective bounce could be the below-50 levels of the RSI (14) line.
However, a clear upside break of a seven-day-long descending resistance line, around 0.6635 by the press time, becomes necessary to recall the AUD/USD buyers.
Even so, the weekly high of around 0.6710 and convergence of the 100-DMA and 38.2% Fibonacci retracement of the pair’s run-up from October 2022 to February 2023, near 0.6785, can challenge the AUD/USD bulls.
Alternatively, a daily closing below the stated channel’s bottom line, close to the 0.6600 round figure, could quickly fetch the Aussie bears to the 61.8% Fibonacci retracement level of near 0.6550.
AUD/USD: Daily chart
Trend: Gradual downside expected
Information on these pages contains forward-looking statements that involve risks and uncertainties. Markets and instruments profiled on this page are for informational purposes only and should not in any way come across as a recommendation to buy or sell in these assets. You should do your own thorough research before making any investment decisions. FXStreet does not in any way guarantee that this information is free from mistakes, errors, or material misstatements. It also does not guarantee that this information is of a timely nature. Investing in Open Markets involves a great deal of risk, including the loss of all or a portion of your investment, as well as emotional distress. All risks, losses and costs associated with investing, including total loss of principal, are your responsibility. The views and opinions expressed in this article are those of the authors and do not necessarily reflect the official policy or position of FXStreet nor its advertisers.
