AUD/USD Price Analysis: Finds support near 0.6660, downside seems favored as China’s CPI remains stagnant
|
- AUD/USD has found support after sheer selling pressures inspired by weak inflation in China.
- Expectations have increased that inflation would further turn sticky as June wage numbers seem uncomfortable for the Fed policymakers.
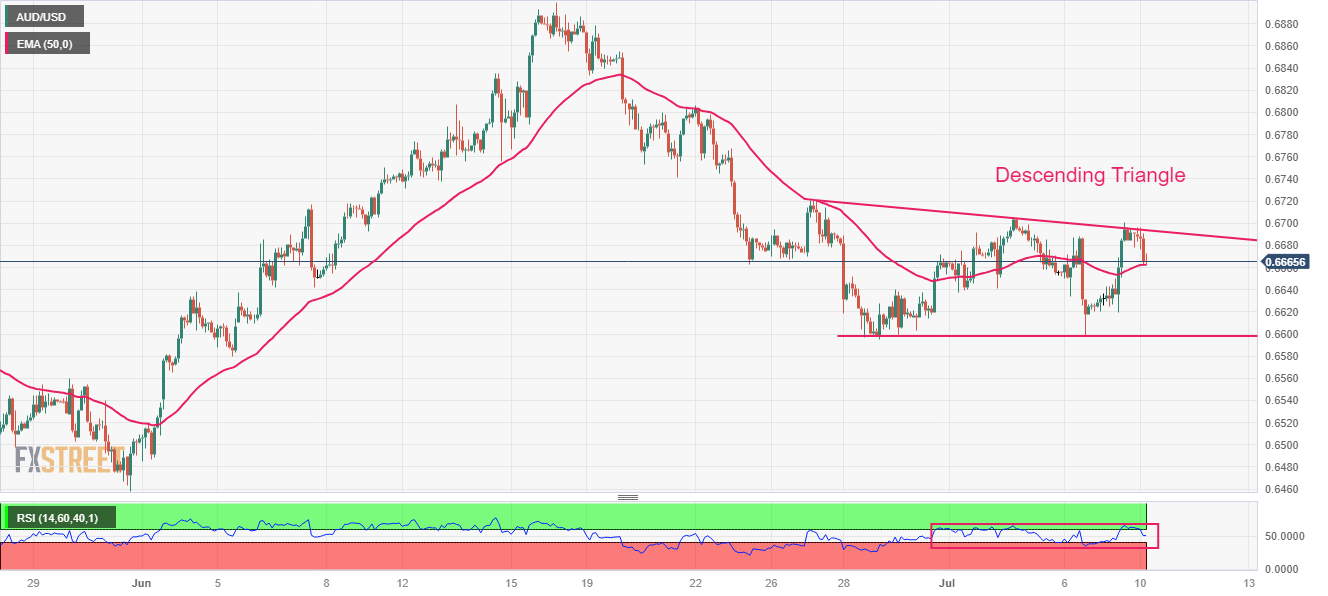
- AUD/USD has faced stiff barricades near the downward-sloping trendline of the Descending Triangle pattern.
The AUD/USD pair has found intermediate support near the crucial support of 0.6660 in the Asian session. The Aussie asset is expected to continue its downside journey amid headwinds of a significantly low Consumer Price Index (CPI) in China and expectations that inflation in the United States will remain stubborn.
Monthly inflation in China for June remained stagnant vs. a figure of 0.2%. Annual CPI remained decelerated at 0.2%, similar to its prior release. Meanwhile, the annual Producer Price Index (PPI) has further decelerated to -5.4% vs. the former release of -4.6%. Lower factory-gate prices indicate that domestic and export demand is extremely vulnerable.
On the United States Dollar front, expectations have increased that inflation would further turn sticky as June wage numbers seem uncomfortable for the Federal Reserve (Fed) policymakers. Monthly economic data maintained a pace of 0.4% and remained higher than the consensus of 0.3%. Also, Annualized Average Hourly Earnings remained at a steady pace of 4.4%.
AUD/USD has faced stiff barricades near the downward-sloping trendline of the Descending Triangle chart pattern formed on a two-hour scale. The downward-sloping trendline of the aforementioned pattern is plotted from June 27 high at 0.6720 while the horizontal support is placed from June 29 low at 0.6595.
The 50-period Exponential Moving Average (EMA) at 0.6620 is providing some cushion to the Australian Dollar bulls.
Meanwhile, the Relative Strength Index (RSI) (14) is oscillating in the 40.00-60.00 range, portraying a non-directional performance.
A confident break June 29 low at 0.6595 would drag the asset toward June 02 low at 0.6565 and the round-level support at 0.6500.
On the flip side, a decisive break above July 04 high at 0.6705 would expose the asset to June 23 high at 0.6767, followed by the round-level resistance at 0.6800.
AUD/USD two-hour chart
Information on these pages contains forward-looking statements that involve risks and uncertainties. Markets and instruments profiled on this page are for informational purposes only and should not in any way come across as a recommendation to buy or sell in these assets. You should do your own thorough research before making any investment decisions. FXStreet does not in any way guarantee that this information is free from mistakes, errors, or material misstatements. It also does not guarantee that this information is of a timely nature. Investing in Open Markets involves a great deal of risk, including the loss of all or a portion of your investment, as well as emotional distress. All risks, losses and costs associated with investing, including total loss of principal, are your responsibility. The views and opinions expressed in this article are those of the authors and do not necessarily reflect the official policy or position of FXStreet nor its advertisers.
