AUD/USD Price Analysis: Approaches H&S neckline below 0.6900
|
- The recovery move by AUD/USD might meet offers amid the risk-off mood.
- A surprise rise in the US inflation would accelerate rate hike odds by the Fed.
- A confident drop below the H&S neckline will trigger a bearish reversal.
The AUD/USD pair has shown a responsive buying action after surrendering the round-level support of 0.6900 in the Asian session. The Aussie asset has attempted a recovery move, however, the Australian Dollar could retreat ahead as the risk impulse is quite negative amid airborne threats to the United States.
The US Dollar Index (DXY) is expected to recapture the 103.50 resistance ahead investors are getting anxious ahead of the release of the United State inflation data. S&P500 futures are extending their losses as investors are expecting that a surprise rise in the US inflation would accelerate rate hike odds by the Federal Reserve (Fed) and eventually will escalate recession fears. The 10-year US Treasury yields are struggling to extend gains above 3.75%.
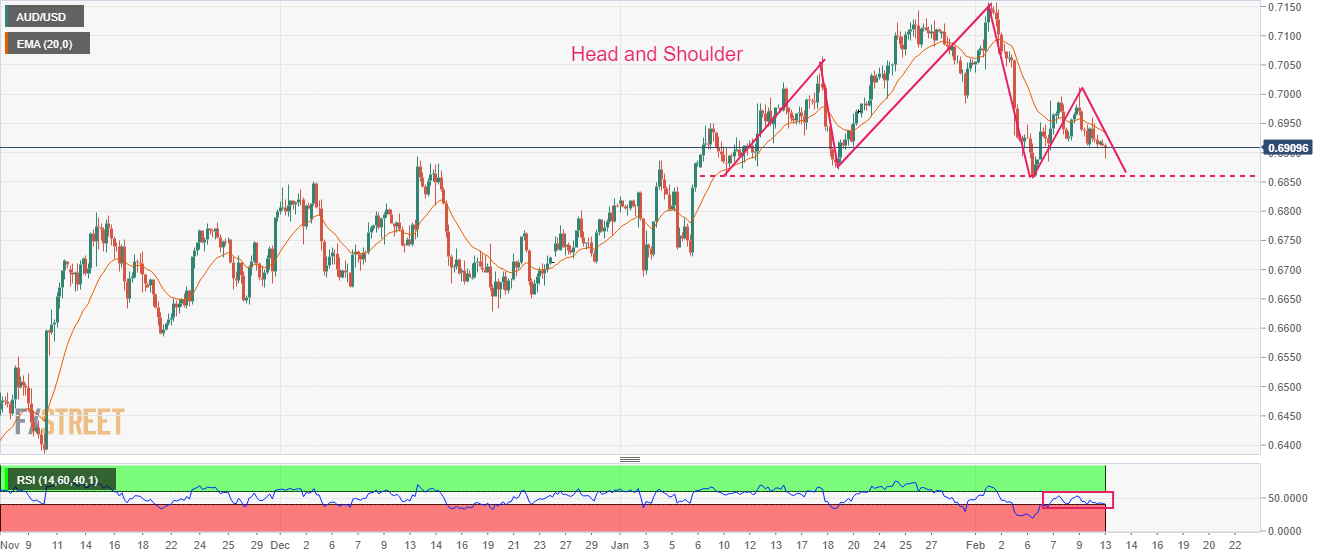
AUD/USD is completing the last leg of the Head and Shoulder chart pattern on a four-hour scale. The aforementioned chart pattern is a prolonged consolidation and a breakdown of the neckline plotted from the January 10 low at 0.6860 will trigger a bearish reversal.
The asset is facing barricades each time encountering the 20-period Exponential Moving Average (EMA) at 0.6398, indicating more weakness ahead.
Meanwhile, the Relative Strength Index (RSI) (14) is struggling to sustain itself in the 40.00-60.00 range. A slippage into the bearish range of 20.00-40.00 will trigger the bearish momentum.
A breakdown below the neckline plotted from January 10 low at 0.6860 will drag the asset toward December 28 high around 0.6800. A slippage below the latter will further drag the asset toward December 22 high at 0.6767.
In an alternate scenario, a decisive break above the psychological resistance of 0.7000 will drive the asset towards January 18 high at 0.7064 followed by January 26 high at 0.7143.
AUD/USD four-hour chart
Information on these pages contains forward-looking statements that involve risks and uncertainties. Markets and instruments profiled on this page are for informational purposes only and should not in any way come across as a recommendation to buy or sell in these assets. You should do your own thorough research before making any investment decisions. FXStreet does not in any way guarantee that this information is free from mistakes, errors, or material misstatements. It also does not guarantee that this information is of a timely nature. Investing in Open Markets involves a great deal of risk, including the loss of all or a portion of your investment, as well as emotional distress. All risks, losses and costs associated with investing, including total loss of principal, are your responsibility. The views and opinions expressed in this article are those of the authors and do not necessarily reflect the official policy or position of FXStreet nor its advertisers.