AUD/JPY Price Analysis: Remains confined near 95.00 following RBA Meeting Minutes
|
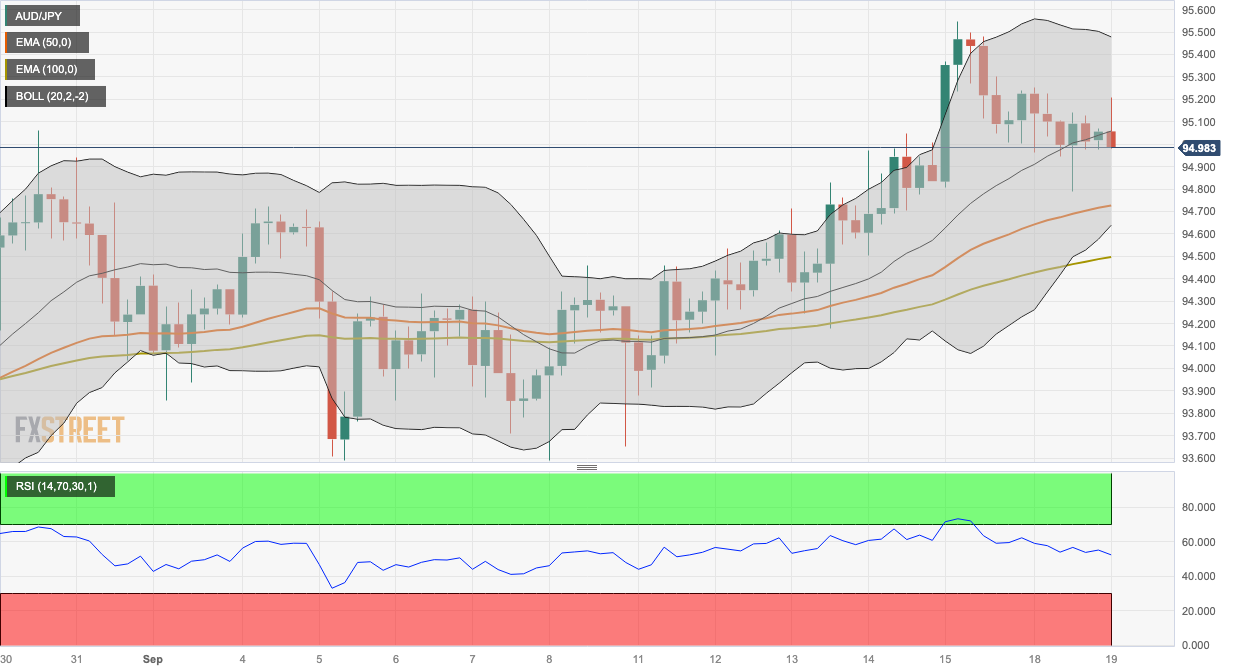
- AUD/JPY trades sideways near 94.98 following the RBA Meeting Minutes.
- The cross holds above the 50- and 100-hour EMAs; Relative Strength Index (RSI) stands in the bullish territory.
- The immediate resistance level emerges at 95.48; the initial support level is seen at 94.72.
The AUD/JPY cross remains confined around 94.95-95.20 in a narrow trading band during the Asian trading hours on Tuesday. The cross currently trades near 94.98, losing 0.03% on the day.
On Tuesday, the release of the Minutes from the Reserve Bank of Australia's (RBA) September monetary policy meeting revealed that additional tightening may be necessary if inflation proves more persistent than anticipated. However, the case for maintaining the status quo was stronger, and recent data have not materially altered the economic outlook.
According to the four-hour chart, the path of least resistance for the AUD/JPY is to the upside as the cross holds above the 50- and 100-hour Exponential Moving Averages (EMAs). Meanwhile, the Relative Strength Index (RSI) holds above 50 in the bullish territory, which supports the buyers for now.
Looking at the upside, the immediate resistance level for AUD/JPY emerges near the upper boundary of the Bollinger Band at 95.48. Any follow-through buying above the latter will see a rally to 95.78 (a high of July 21), followed by a high of July 4 at 96.85. The next barrier to watch is a Year-To-Date (YTD) high of 97.62. en route to 98.00 (a psychological round mark).
On the flip side, the cross will meet the initial support level near the 50-day EMA at 94.72. The next downside filter appears at 94.65 (the lower limit of the Bollinger Band) en route to 94.50 (the 100-hour EMA). A break below the latter will see a drop to a psychological round figure at 94.00.
AUD/JPY four-hour chart
Information on these pages contains forward-looking statements that involve risks and uncertainties. Markets and instruments profiled on this page are for informational purposes only and should not in any way come across as a recommendation to buy or sell in these assets. You should do your own thorough research before making any investment decisions. FXStreet does not in any way guarantee that this information is free from mistakes, errors, or material misstatements. It also does not guarantee that this information is of a timely nature. Investing in Open Markets involves a great deal of risk, including the loss of all or a portion of your investment, as well as emotional distress. All risks, losses and costs associated with investing, including total loss of principal, are your responsibility. The views and opinions expressed in this article are those of the authors and do not necessarily reflect the official policy or position of FXStreet nor its advertisers.