AUD/JPY Price Analysis: Clings to minimal gains above 88.00
|
- AUD/JPY jumped from YTD lows of 87.12 and reclaimed 88.00 as sentiment turned upbeat.
- AUD/JPY Price Analysis: To remain sideways within the 87.00/89.00 range.
AUD/JPY trimmed some of its earlier losses and finished Monday’s session with losses of 0.13%. However, as the Asian session begins, the AUD/JPY is up 0.09%, exchanging hands at 88.25 at the time of writing.
AUD/JPY Price action
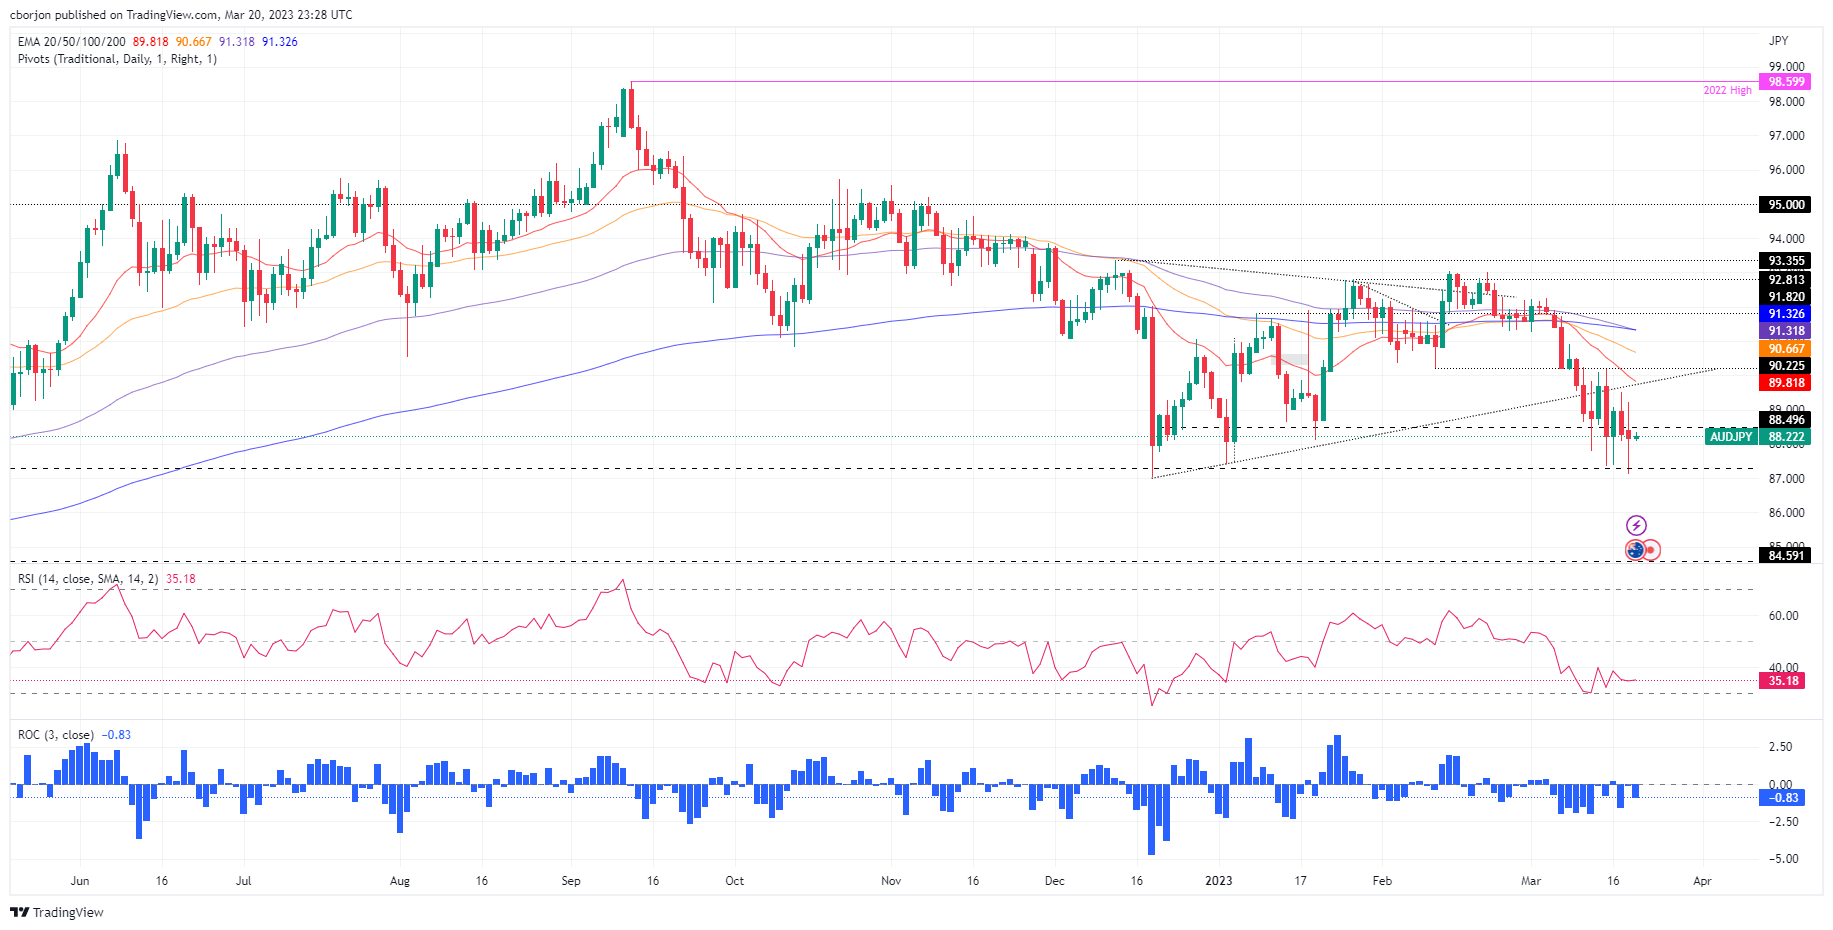
After falling to multi-week lows at 87.12, the AUD/JPY staged a late recovery and closed above the 88.00 figure, portraying a spinning top indicating neither buyers nor sellers are in control. Nevertheless, the AUD/JPY is consolidating around the 87.00-89.20 range, below the daily Exponential Moving Averages (EMAs), with a neutral to a bearish bias.
Oscillators remain bearish, but the Relative Strength Index (RSI) turned flat, suggesting that selling pressure is waning. Contrarily, the Rate of Change (RoC) portrays sellers are gathering momentum, but they need to bring the AUD/JPY below 88.00, so they could have a chance to drag prices lower.
Therefore, the AUD/JPY’s first support would be the 88.00 mark. Once cleared, the AUD/JPY could dive towards the daily low at 87.12 before stumbling toward the 86.00 mark, ahead of testing March 2022 lows at around 84.59.
Conversely, the AUD/JPY first resistance would be 89.00. Break above will expose the March 20 daily high at 89.23 before testing the 20-day EMA at 89.82. After that, the next supply zone would be the 90.00 figure, followed by the 50-day EMA at 90.66, ahead of 91.00.
AUD/JPY Daily chart
AUD/JPY Technical levels
Information on these pages contains forward-looking statements that involve risks and uncertainties. Markets and instruments profiled on this page are for informational purposes only and should not in any way come across as a recommendation to buy or sell in these assets. You should do your own thorough research before making any investment decisions. FXStreet does not in any way guarantee that this information is free from mistakes, errors, or material misstatements. It also does not guarantee that this information is of a timely nature. Investing in Open Markets involves a great deal of risk, including the loss of all or a portion of your investment, as well as emotional distress. All risks, losses and costs associated with investing, including total loss of principal, are your responsibility. The views and opinions expressed in this article are those of the authors and do not necessarily reflect the official policy or position of FXStreet nor its advertisers.
