Where is Supply for an All-Time High?
|As prices in the Indian equity markets approach the previous highs set in 2010, there are a lot of stocks that are making 52-week or even all-time highs. As traders, we know that we should participate in the dominant trend but base our exits on supply and demand zones. But where are we supposed to exit when we do not have a zone as a signal?
Fortunately, there are several techniques that we can use to identify probable exit point to protect our profits. Remember, none of these are as strong as actual supply zones but they do seem to offer higher probability targets when we are breaking out into unknown territory.
The first method is one of the easiest. Before prices break to new highs, it often pulls back to gain momentum. If you measure the depth of the pullback and then project that same length at the breakout, it will often mark the area of the first correction after the breakout.
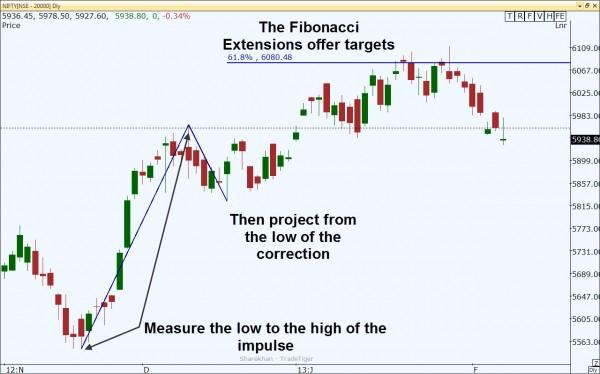
The next method offers multiple targets and uses a tool that is available on most software platforms. The Fibonacci extension tool measures the impulse prior to the breakout and then projects certain measurements of that impulse from the recent lows. By doing this, you can often identify the area where the breakout impulse will stall.
The last method is to simply wait for a signal that the trend has been broken. Moving averages offer a summary of the current trend and the mean price. In a bullish trend, prices should move away from an average and then snap back to it but not close below the moving average. This is called reversion to the mean. If price breaks the moving average by closing below it, then the trend has likely ended.
There are two problems with this technique. First, you will never exit at the top of the move since we wait for a pullback to trigger the exit. That is fine though as we can still participate and profit from the majority of the move.
Secondly, is the choice of the moving average period. We need to select a period or length of the moving average that price will respect for the trend. Stocks and timeframes differ and one moving average may not work for all securities. There are some advanced techniques for finding the best length but I will save that for discussion in our courses.
So if the price of your security breaks to new highs, you might now be better prepared to take your profits at the right time rather than trying to guess. To learn more, contact your local Online Trading Academy center and enroll in the Professional Trader course today.
Information on these pages contains forward-looking statements that involve risks and uncertainties. Markets and instruments profiled on this page are for informational purposes only and should not in any way come across as a recommendation to buy or sell in these assets. You should do your own thorough research before making any investment decisions. FXStreet does not in any way guarantee that this information is free from mistakes, errors, or material misstatements. It also does not guarantee that this information is of a timely nature. Investing in Open Markets involves a great deal of risk, including the loss of all or a portion of your investment, as well as emotional distress. All risks, losses and costs associated with investing, including total loss of principal, are your responsibility. The views and opinions expressed in this article are those of the authors and do not necessarily reflect the official policy or position of FXStreet nor its advertisers.