Bitcoin's bearish slide amid Israel-Iran tensions: A bullish rebound in sight?
|
On March 16, I forecasted that Bitcoin would likely revisit the $73,600 level. It hit $72,600 just before a sudden downturn triggered by geopolitical events. As the world watches the unfolding tensions in the Middle East, Bitcoin's market reaction has been sharply bearish, with prices tumbling from a high of $74,000 to just below $61,000. This drop raises the pivotal question: is the cryptocurrency market heading for a bullish recovery or steering into a deeper bearish phase? This blog delves into the complexities of the current Bitcoin landscape, guided by the structured Trading Genius Formula inspired by W.D. Gann. I am going to show you how to apply the Overbalance of Time and Price using the Natural Law of Action and Reaction to forecast and discern what might be on the horizon.
The seven dimensions of market analysis
Our comprehensive framework—The 7th Dimension Analysis—draws on mathematical principles and market dynamics to analyze the market structure, cycle, and market reversal. Let's explore each dimension to understand how you can discern the trend profit from the market.
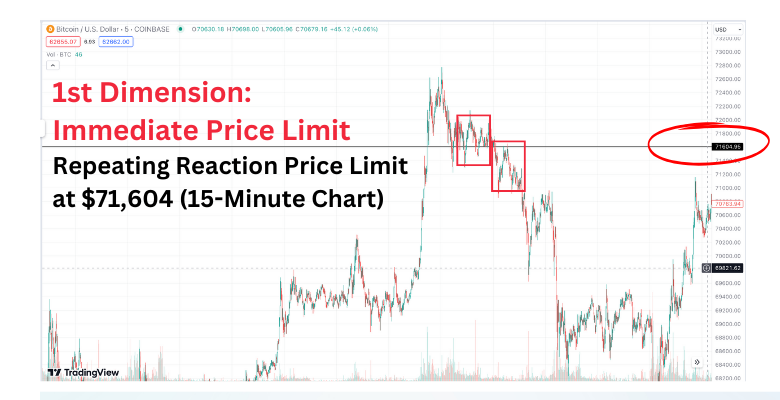
1. Immediate Price Limits (1st Dimension)
Setting a repeating reaction price limit at $71,604 on a 15-minute chart offers a precise threshold for short-term trading decisions.
2. Extended Time Frame Analysis (2nd Dimension)
A repeating reaction price limit at $68,423 on a 4-hour chart establishes a broader perspective and helps gauge longer-term market sentiment.
3. News: Theme vs. Price (3rd Dimension)
A slew of news and distractions constantly emerge on Bitcoin and cryptocurrency. Events such as BTC halving or macroeconomic updates can drive significant price shifts. Due to this noise, it's even harder to know the right time to enter or exit the market.
My Pro-Tip: Never speculate on the news. Let the news circulate and check against the news timestamp to determine whether it causes a market reversal and whether it is the ‘Profitable NOISE’ price mover during the current cycle.
4. Reaction Time Limits (4th Dimension)
According to Gann, "The TIME FACTOR is the most important. When TIME is up, time or space movements will reverse."
He also noted: "Remember that the 'overbalancing' of TIME is the most important indication of a change in trend."
This builds on the first and second dimensions. The market operates on various dimensions, and here, we focus on the repeating time vibratory number. During the repeated reaction time limit, when the market drops to a new low and rebounds to a lower high, you should add the vibratory time number. If the price holds, that means the time is up, and it provides a good entry or exit point based on the first or second dimensions.
5. Volume-Supported Trendlines (5th Dimension)
Trendlines often break down, right? My Traction Trendline incorporates trading volume to identify support and resistance levels when the market truly gains traction.
6. & 7. Astrological Timing & Pricing (6th and 7th Dimensions) - PROOF Below
This final dimension integrates astrological forecasts with pricing. Read the PROOF from my forecast in our trading room:
Mar 6: The price of BTC is at 66,450, and the stop loss at $62,000 is expected to move beyond the $70K level.
Mar 12: See how the dark energy pushes the market and prevents it from touching the price at the $62,000 level.
Mar 16: The market will likely revisit $73,600, so I revised my target from $80,000 to $73,600.
I forecasted that Bitcoin would likely revisit the $73,600 level. It hit $72,600 just before a downturn triggered by sudden geopolitical events in the Middle East.
Conclusion: Viewing market mastery through W.D. Gann’s Lens
Understanding each dimension provides the correct lens to view the market accurately. This is how you apply the overbalance of time and price using the natural law of action and reaction. To effectively calculate the 'balancing,' it's crucial to know when a cycle begins and ends, as covered in the Trading Genius Formula. However, in my experience, time and price represent two distinct domains. This is how time and price mesh together to generate trading signals. Whether the market trends are bullish or bearish, armed with the right tools and knowledge, traders can navigate Bitcoin's volatility with greater confidence and precision.
Information on these pages contains forward-looking statements that involve risks and uncertainties. Markets and instruments profiled on this page are for informational purposes only and should not in any way come across as a recommendation to buy or sell in these assets. You should do your own thorough research before making any investment decisions. FXStreet does not in any way guarantee that this information is free from mistakes, errors, or material misstatements. It also does not guarantee that this information is of a timely nature. Investing in Open Markets involves a great deal of risk, including the loss of all or a portion of your investment, as well as emotional distress. All risks, losses and costs associated with investing, including total loss of principal, are your responsibility. The views and opinions expressed in this article are those of the authors and do not necessarily reflect the official policy or position of FXStreet nor its advertisers.
