Zilliqa Price Prediction: ZIL could be on the verge of a massive 600% breakout
|- ZIL is currently trading at $0.0181 inside what seems to be a massive bull flag.
- A positive breakout above this pattern has the potential to drive Zilliqa up to $0.20.
Zilliqa had quite a crazy 2020 starting in January at a price of $0.0045 and crashing down to $0.003 in March. However, ZIL’s recovery was one of the best going from that low to a peak of $0.0258 only a few months later and reaching a $270 million market capitalization.
ZIL bulls could be eying up a colossal 600% breakout
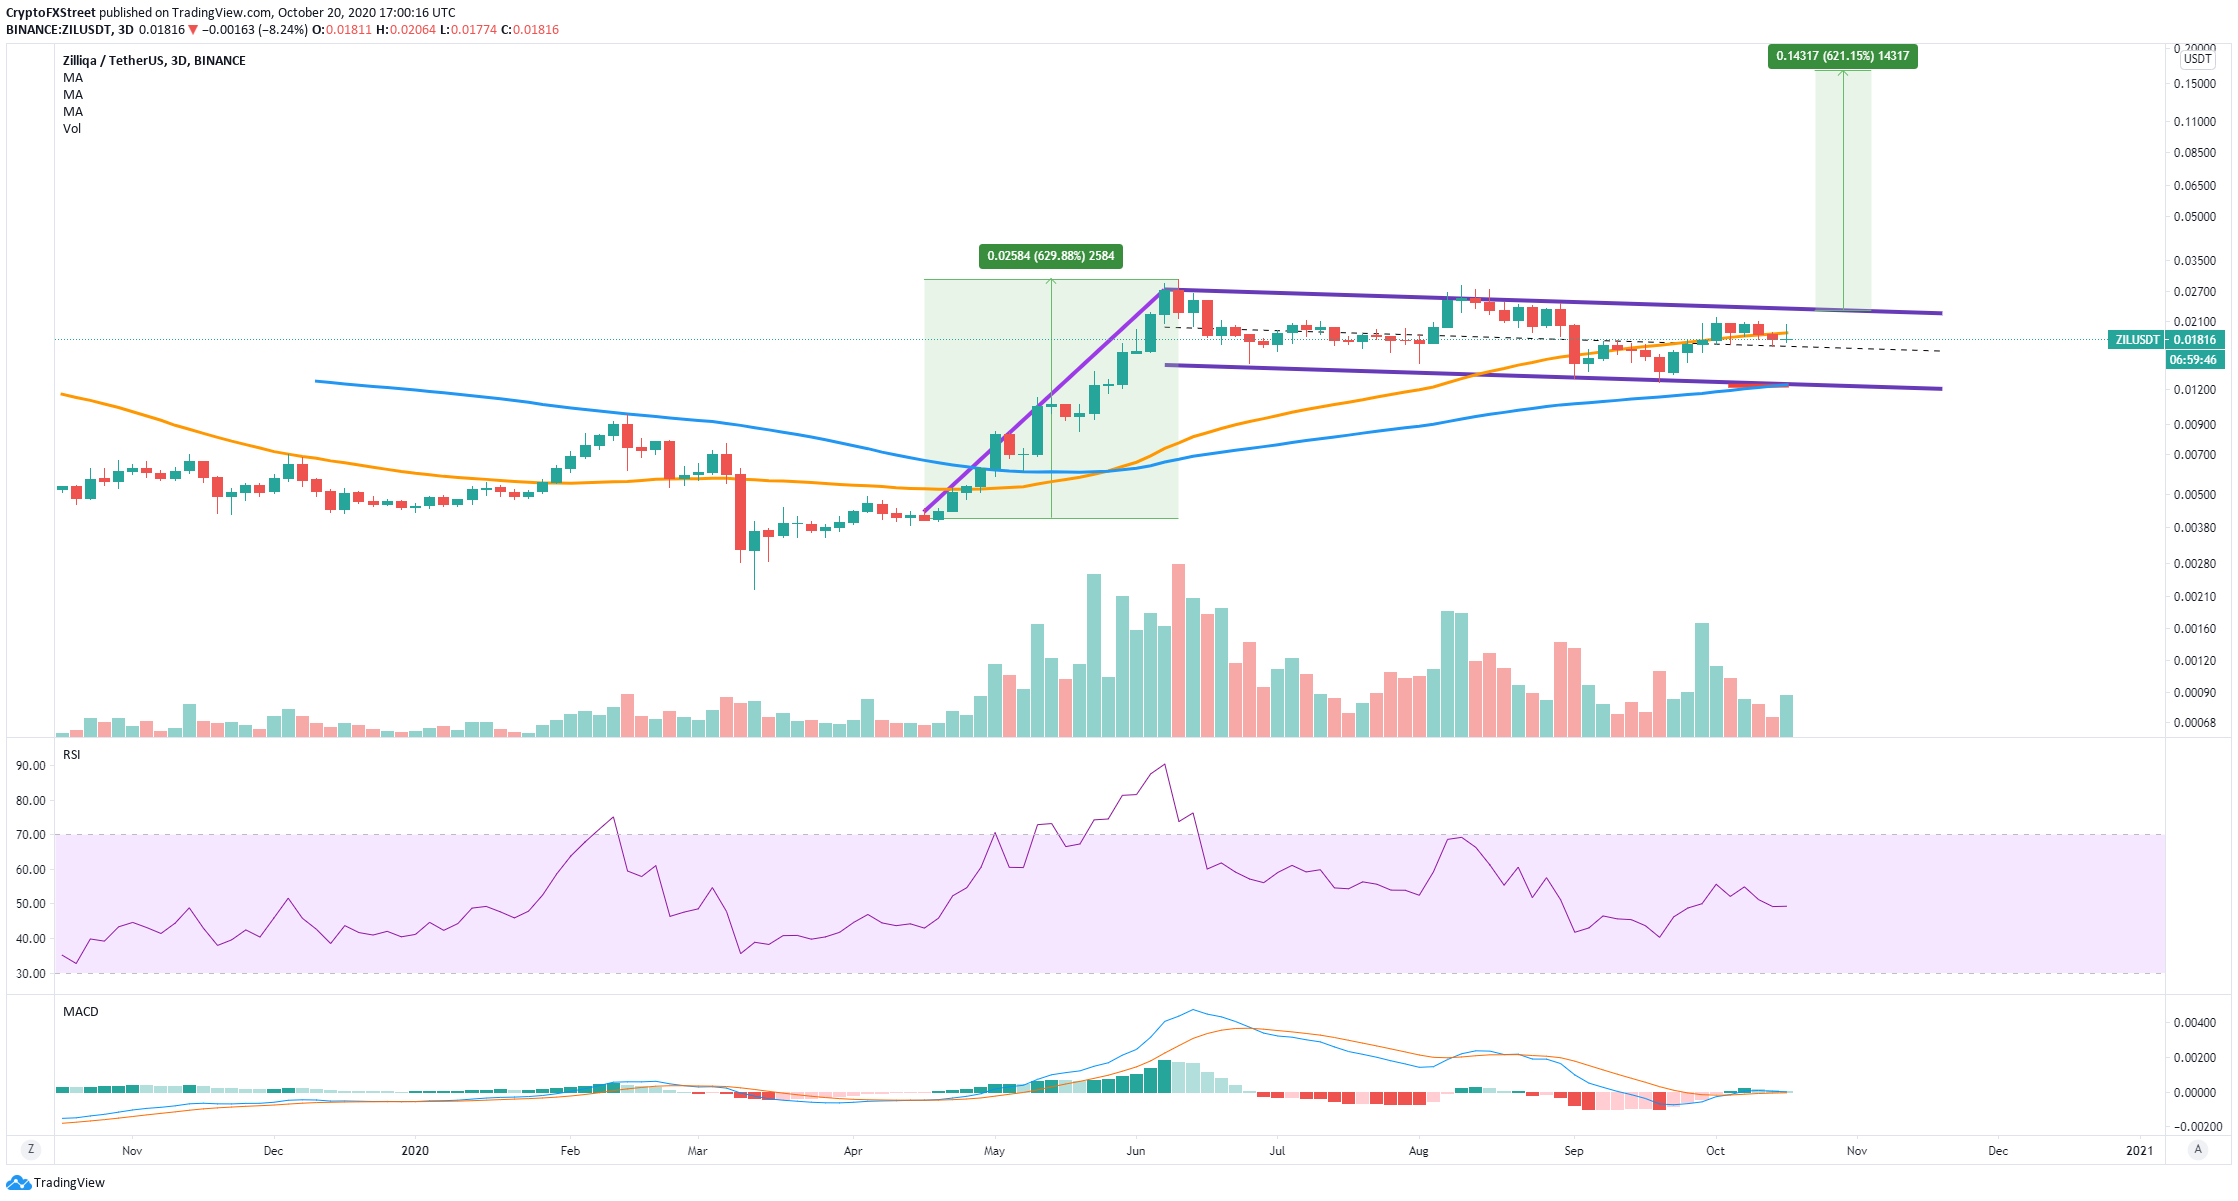
A significant pattern has been developing on the 3-day chart. It seems that a huge bull flag was established by the bulls after an initial 630% price explosion on April 18. The price of ZIL is currently trading sideways, seeking the bullish breakout of the flag.
ZIL/USD 3-day chart
ZIL is currently fighting to stay above the 50-SMA after turning the MACD bullish on October 6. We know a breakout above the upper trendline at $0.023 can push the price of Zilliqa by up to 600% since this percentage is equal to the flag pole.
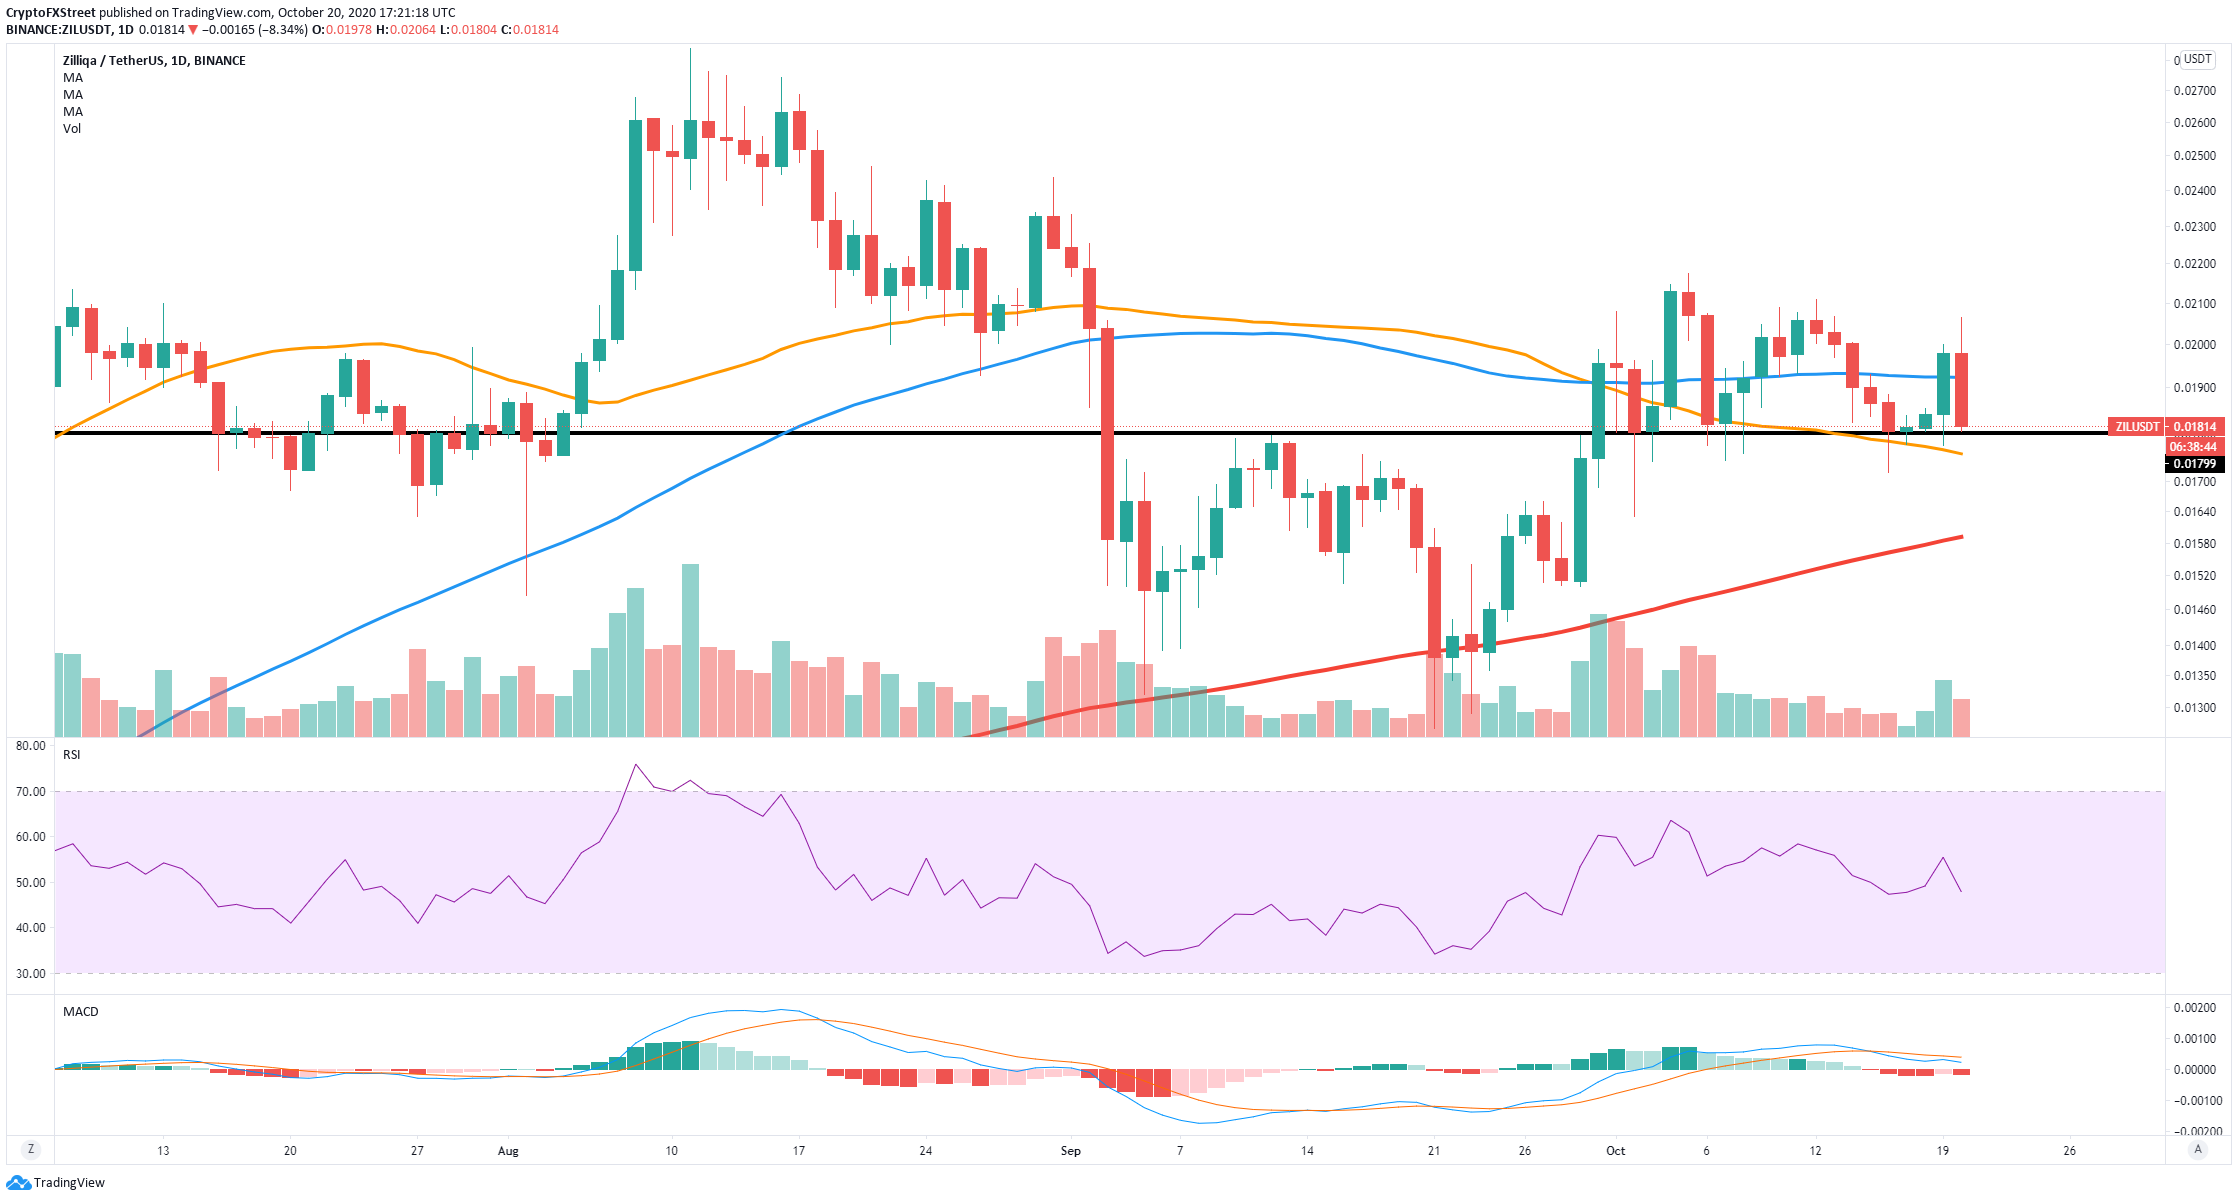
ZIL/USD daily chart
On the daily chart, the bulls have been in control for the most part. ZIL is still trading above the 50-SMA and the 200-SMA and fighting to stay over the 100-SMA. The digital asset established a robust support level at $0.0179 which almost coincides with the 50-SMA.
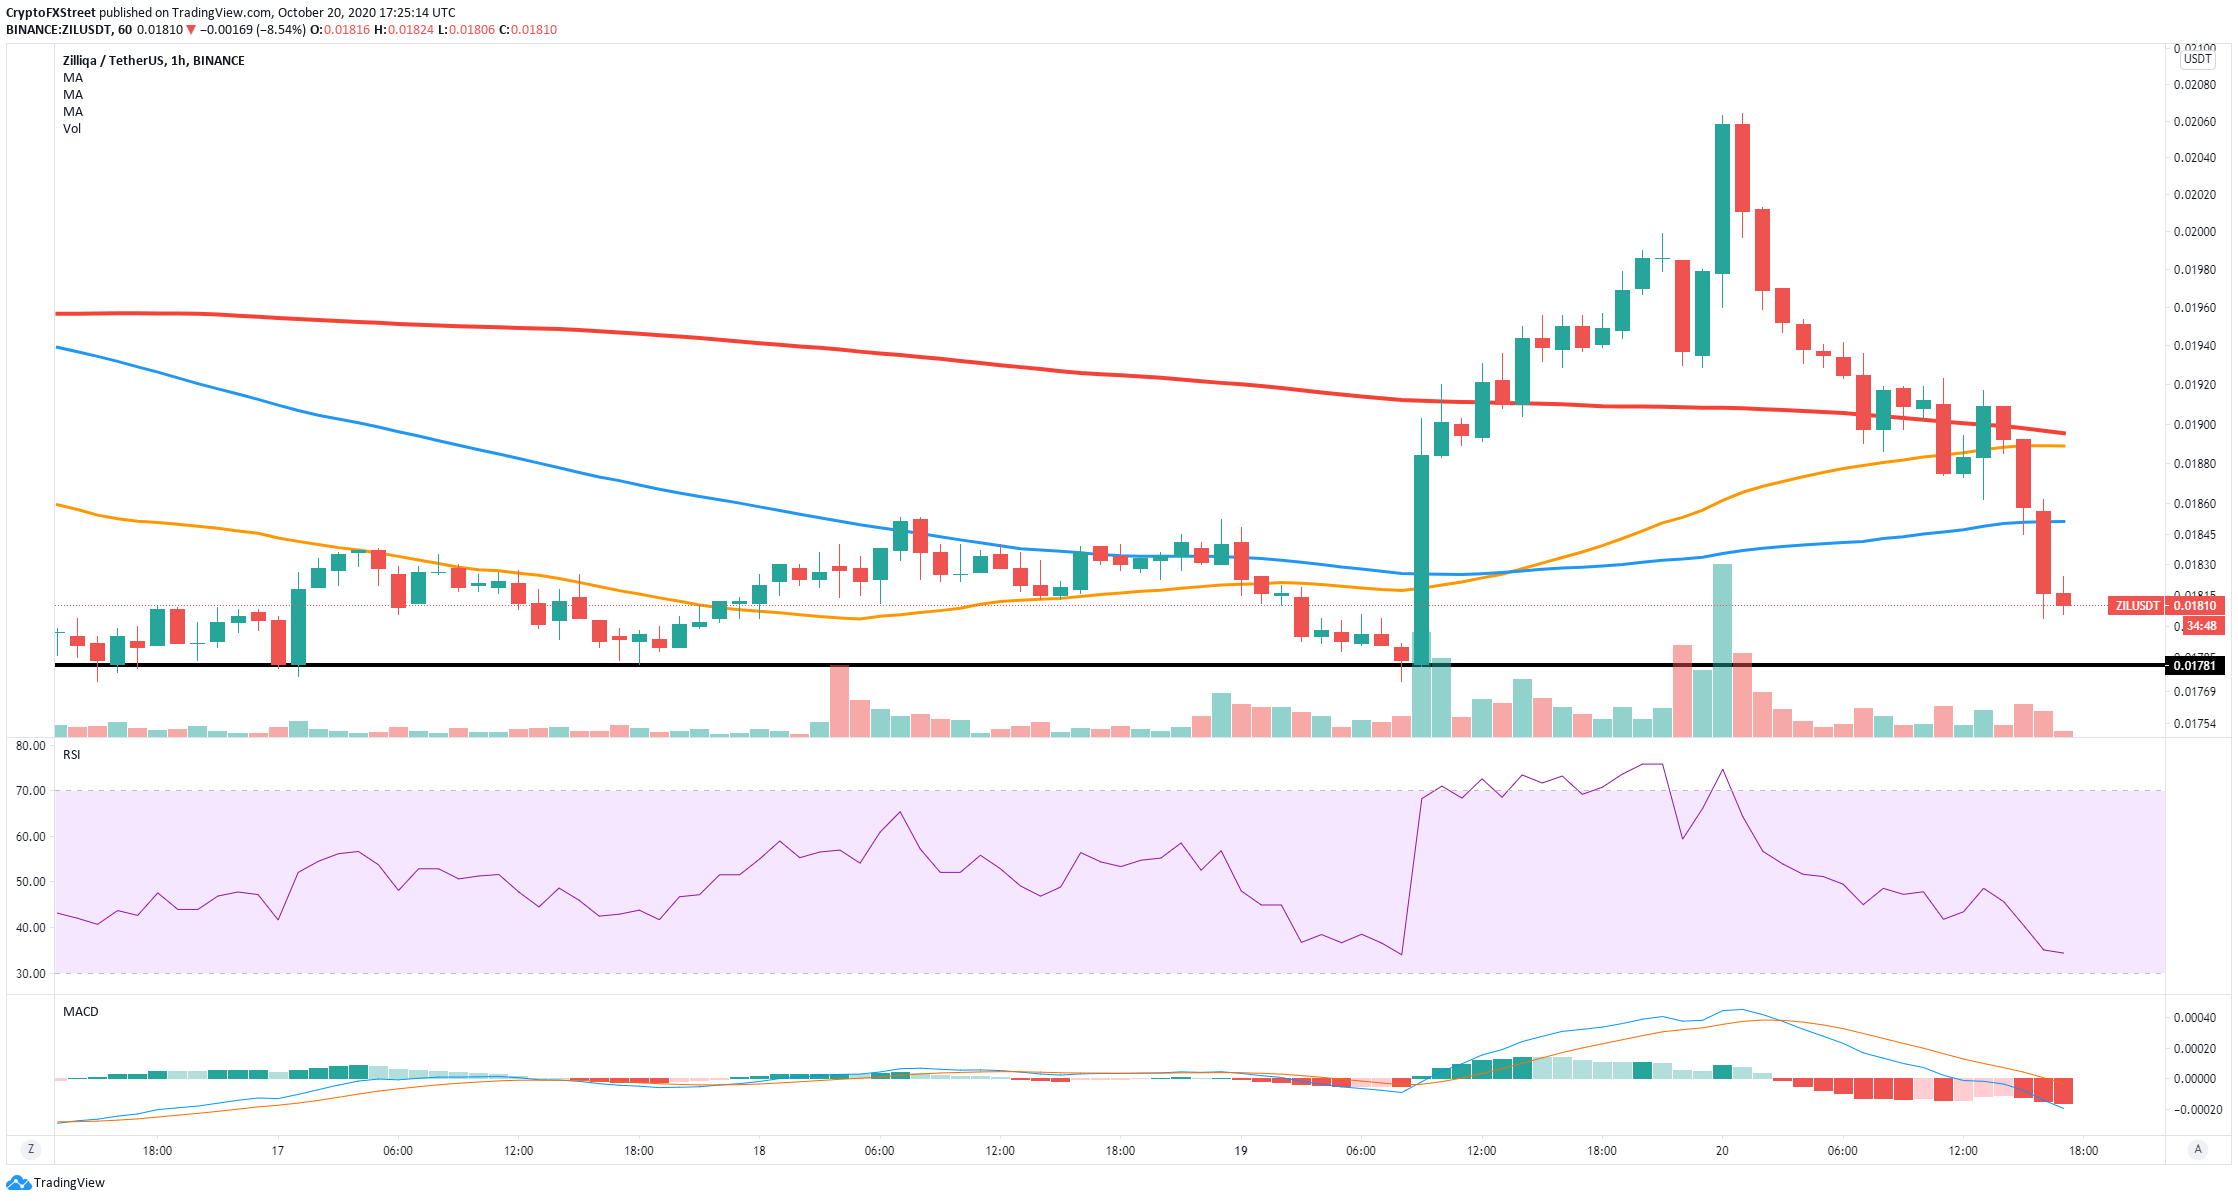
ZIL/USD 1-hour chart
On the other hand, it seems that the short-term is in favor of the bears. On the hourly chart, the price of ZIL has slipped below the 50-SMA, 100-SMA, and 200-SMA, turning all three into resistance levels on the way up.
Additionally, the MACD turned bearish around 15 hours ago and it’s gaining strength. The next support level is located at $0.0178, a breakout below this point can easily send ZIL towards the low of $0.0171 and potentially lower in the longer-term.
Crucial price points for bulls and bears
Bulls are paying close attention to the bull flag formed on the 3-day chart. A breakout above the upper trendline of the pattern can have an explosive effect over ZIL pushing the digital asset by around 600% in the long-term, towards $0.20.
On the other hand, it seems that for now, the short-term is in favor of the bears which are eying up a breakout below a crucial support level at $0.0178. Failure to hold this level can drive ZIL down to $0.0171 and perhaps even lower in the longer-term.
Information on these pages contains forward-looking statements that involve risks and uncertainties. Markets and instruments profiled on this page are for informational purposes only and should not in any way come across as a recommendation to buy or sell in these assets. You should do your own thorough research before making any investment decisions. FXStreet does not in any way guarantee that this information is free from mistakes, errors, or material misstatements. It also does not guarantee that this information is of a timely nature. Investing in Open Markets involves a great deal of risk, including the loss of all or a portion of your investment, as well as emotional distress. All risks, losses and costs associated with investing, including total loss of principal, are your responsibility. The views and opinions expressed in this article are those of the authors and do not necessarily reflect the official policy or position of FXStreet nor its advertisers.