XRP/USD Technical Analysis: XRP recovers from Monday's drop but there is a resistance in sight
|- All of the major crypto's fell on Monday and XRP is trading 3.87% lower.
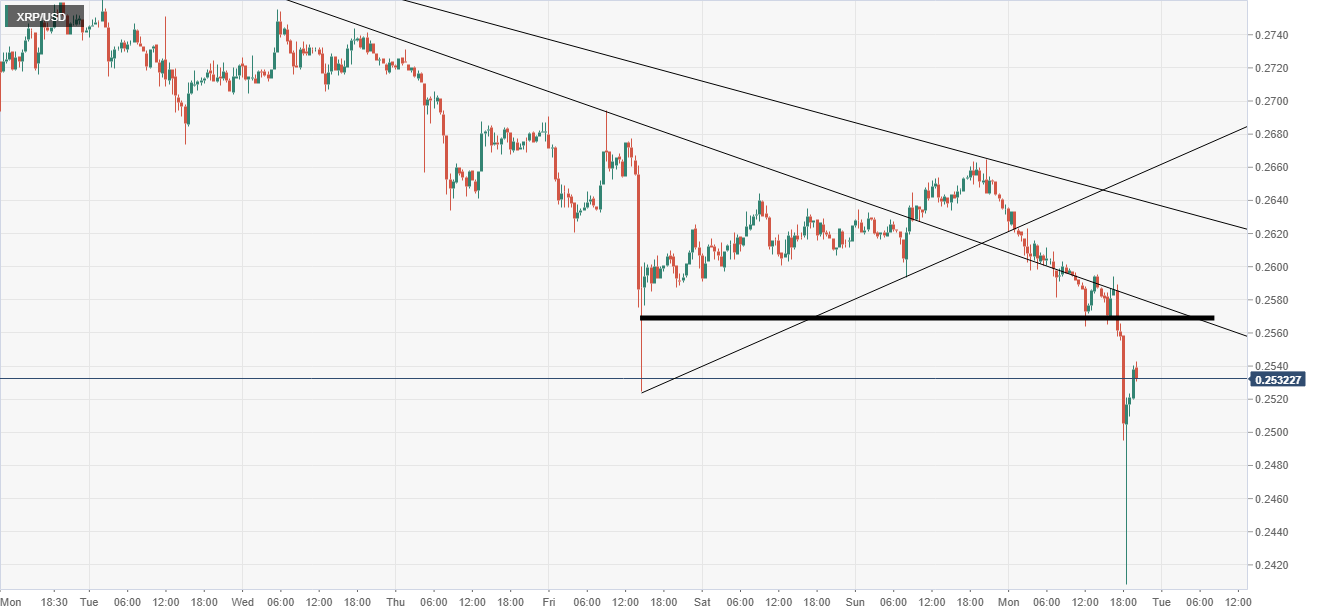
- The XRP/USD price hit a low of 0.2408 but has recovered some of its losses.
XRP/USD 30-Minute Chart
The 30-minute chart below shows the extent of the fall in cryptocurrencies on Monday afternoon.
XRP/USD at one stage traded 9.27% lower but now has recovered to trade only 3.87% lower at the time of writing.
There was no real catalyst for the move but some analysts have attributed the sell-off to the US Federal Reserve looking into a digital dollar.
On the chart, there is a clear resistance at 0.2567 that would need to be taken out to support a move higher.
The daily chart is still showing a clear downtrend since 0.5000 was hit on June 21st 2019.
Additional Levels
Information on these pages contains forward-looking statements that involve risks and uncertainties. Markets and instruments profiled on this page are for informational purposes only and should not in any way come across as a recommendation to buy or sell in these assets. You should do your own thorough research before making any investment decisions. FXStreet does not in any way guarantee that this information is free from mistakes, errors, or material misstatements. It also does not guarantee that this information is of a timely nature. Investing in Open Markets involves a great deal of risk, including the loss of all or a portion of your investment, as well as emotional distress. All risks, losses and costs associated with investing, including total loss of principal, are your responsibility. The views and opinions expressed in this article are those of the authors and do not necessarily reflect the official policy or position of FXStreet nor its advertisers.