XRP sales soared by 211% last quarter, but Ripple trading volume plunged by 50%
|
- All XRP sales in Q3 2021 were attributed to its ODL service, which marked a record quarter.
- Ripple sold $491.74 million in XRP in the third quarter of this year.
- However, XRP trading volume plunged 50% in the same quarter, as the token loses directional bias.
Ripple has recorded an increase of 211% QoQ in its XRP sales, according to the company’s latest Q3 report. Most of the growth has been due to the success of Ripple’s On-Demand Liquidity (ODL) service.
Ripple witnesses massive growth in ODL service
Ripple’s Q3 report revealed that the firm sold $491.74 million worth of XRP in the third quarter, compared to $157.92 million in Q2 2021.
The cross-border remittance company has seen a massive increase in Ripple’s ODL service, which uses XRP as a bridge between fiat currencies, marking the best quarter on record. The service now accounts for 25% of the network’s total dollar volume.
ODL also uses XRP to eliminate pre-funding, reduce operational costs and unlock capital from a large variety of global customers.
According to the report, three billion XRP were released out of escrow, which was in line with the official escrow arrangement.
Despite the firm’s ODL global growth in Q3, the service has seen little traction in the United States due to the ongoing $1.3 billion lawsuit filed by the Securities & Exchange Commission (SEC) against Ripple.
In line with the slump in cryptocurrency trading volumes in the third quarter, XRP trading volume dropped by over 50%, while Bitcoin witnessed roughly a plunge of 33% QoQ.
XRP loses directional bias
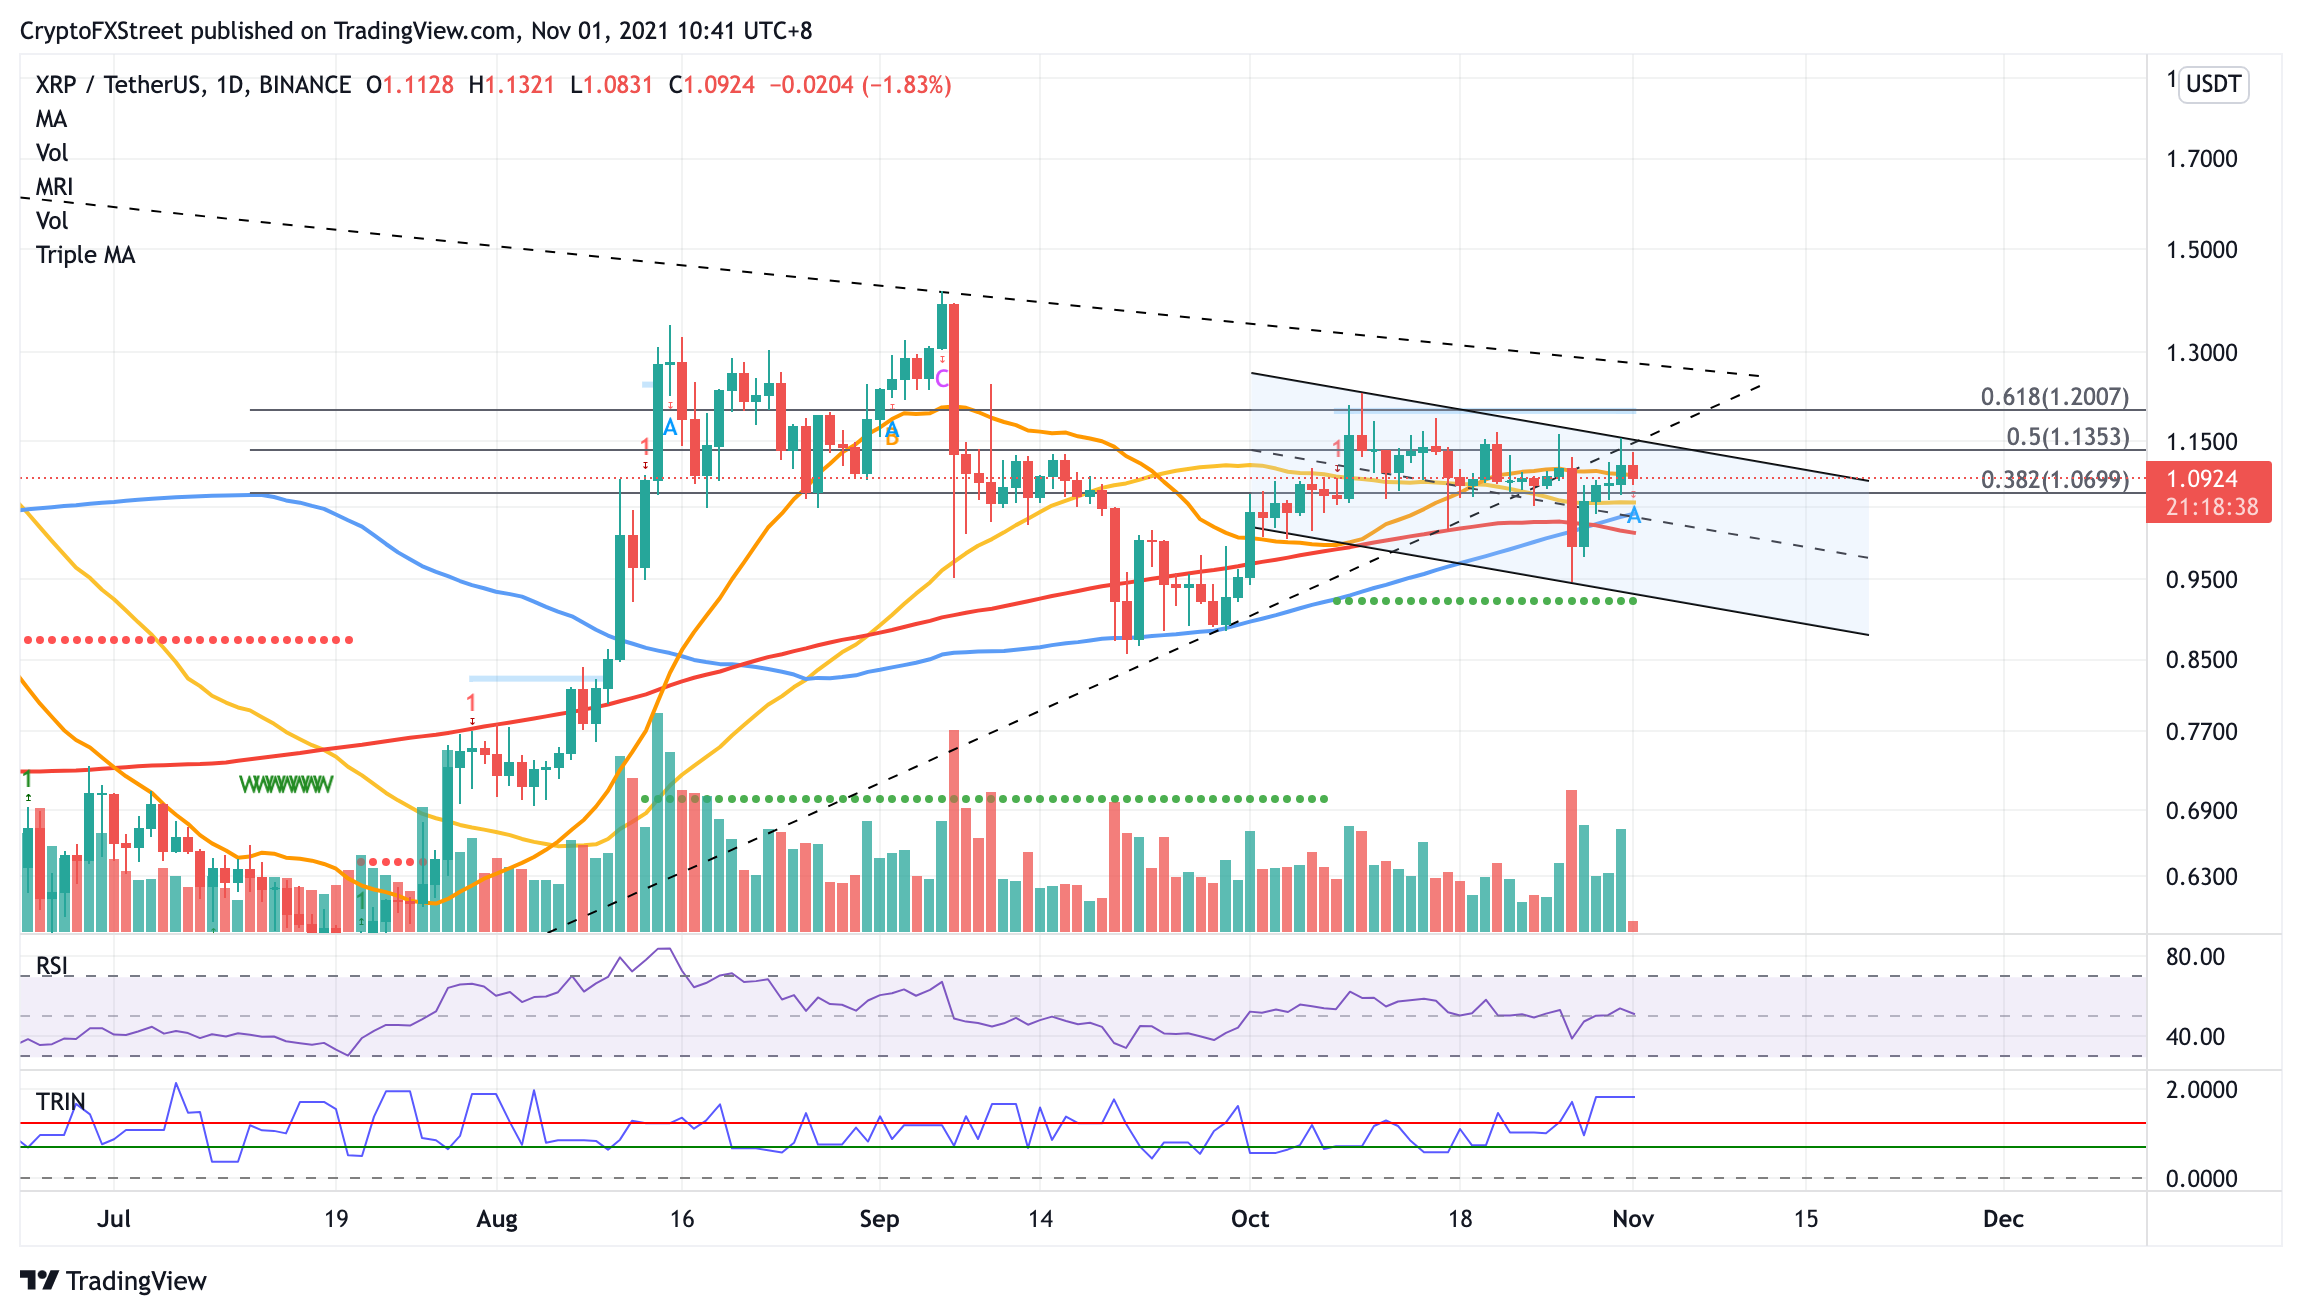
XRP price appears to be headed sideways, as the cross-border remittance token has lost its directional bias. Ripple continues to trend lower within the descending parallel channel on the daily chart.
Until XRP price manages to slice above the upper boundary of the prevailing chart pattern at $1.14, Ripple may continue to be locked within the consolidation pattern.
The first line of defense for XRP price is at the 38.2% Fibonacci retracement level at $1.06, then at the 50-day Simple Moving Average (SMA) at $1.05. Additional support may emerge at the middle boundary of the channel at $1.03, coinciding with the 100-day SMA.
XRP/USDT daily chart
An increase in selling pressure may incentivize the bears to push XRP price lower toward the 200-day SMA at $1.01, then at the lower boundary of the chart pattern at $0.92, corresponding with the support line given by the Momentum Reversal Indicator (MRI).
Information on these pages contains forward-looking statements that involve risks and uncertainties. Markets and instruments profiled on this page are for informational purposes only and should not in any way come across as a recommendation to buy or sell in these assets. You should do your own thorough research before making any investment decisions. FXStreet does not in any way guarantee that this information is free from mistakes, errors, or material misstatements. It also does not guarantee that this information is of a timely nature. Investing in Open Markets involves a great deal of risk, including the loss of all or a portion of your investment, as well as emotional distress. All risks, losses and costs associated with investing, including total loss of principal, are your responsibility. The views and opinions expressed in this article are those of the authors and do not necessarily reflect the official policy or position of FXStreet nor its advertisers.

