XRP Price Analysis: Ripple price has difficulty moving away from technical force at $0.39
|
- Ripple price sees its rally stalling as the Bank of Japan surprises overnight.
- XRP leaves traders puzzled as early comments from ECB member Villeroy triggers a 180 flip.
- Expect to see a choppy day with price action further consolidating.
Ripple (XRP) has traders on edge as volatility is picking up this morning with a massive about-face from risk-off to risk-on as markets try to assess the situation following news from the Bank of Japan and comments from European Central Bank (ECB) official Villeroy just a few hours later. The Bank of Japan surprised friend and fo with an unchanged monetary policy and a decision to stick to its yield curve control, which triggered US Dollar strength and risk-off sentiment across the board. Near the European opening bell, sentiment changed for the better as ECB member Villeroy came out with a hawkish stance, erasing bets that the ECB would only hike 25 basis points in February and instead bettingthat 50 basis point hikes are needed until this summer.
XRP in the crosshairs of the central banks
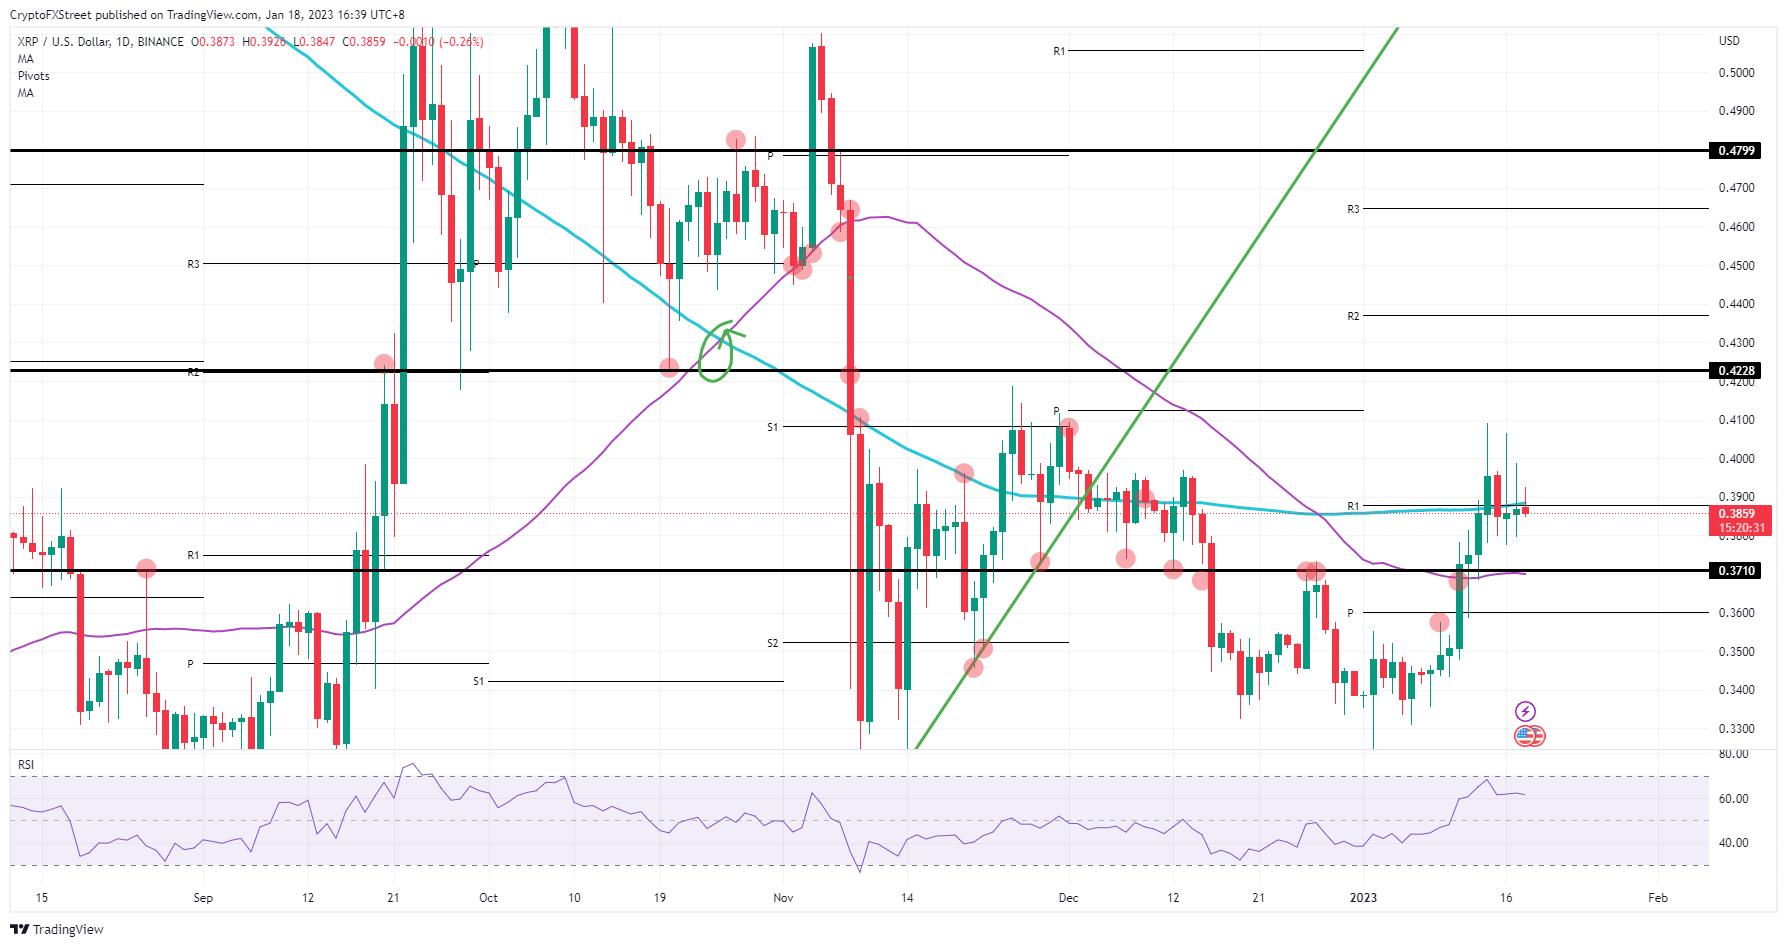
Ripple price might initially be unrelated to the headlines mentioned above, but it is naive to think that cryptocurrencies are immune to this. Although equity markets are allowing mild green numbers, XRP is tanking slightly as the choppy price action could not have come at a worse time and place on the chart. Ripple price needs to make a move on breaking away from the 200-day Simple Moving Average as bulls are starting to lose their faith and patience in the rally.
XRP price thus quickly must move away from $0.39 and preferably even break above $0.41 in a breakout trade. With that move, the road would be open for $0.4228 and would open up a new can of profits. This level is pivotal. Not for January anymore, but if the rally has more legs and room to go, $0.48 could be hit by mid-February if markets let the dust settle over these central bank comments.
XRP/USD daily chart
As price action consolidates, a breakout trade could occur to the downside as the rally stalls a bit. Impatient bulls will start to book more and more profit, certainly with the reasoning that the 200-day SMA support is not holding and could see a big fade back to $0.3710 as the first candidate for support. Add to that the elevated Relative Strength Index, and even $0.36 comes up in the scenarios for a cool-down correction and broader sell-off that erases most of this rally for 2023.
Information on these pages contains forward-looking statements that involve risks and uncertainties. Markets and instruments profiled on this page are for informational purposes only and should not in any way come across as a recommendation to buy or sell in these assets. You should do your own thorough research before making any investment decisions. FXStreet does not in any way guarantee that this information is free from mistakes, errors, or material misstatements. It also does not guarantee that this information is of a timely nature. Investing in Open Markets involves a great deal of risk, including the loss of all or a portion of your investment, as well as emotional distress. All risks, losses and costs associated with investing, including total loss of principal, are your responsibility. The views and opinions expressed in this article are those of the authors and do not necessarily reflect the official policy or position of FXStreet nor its advertisers.
