Uniswap Price Prediction: UNI needs to crack $3.1 for a massive price explosion
|- Uniswap is trading at $3.06 inside a descending parallel channel.
- Bulls are ready for a breakout above a critical resistance level at $3.1.
Uniswap has been in a downtrend for several weeks now while bulls attempt to see any kind of rebound. The digital asset seems to be facing a crucial resistance point. Let’s take a look at several indicators and patterns to determine the direction of the price.
UNI targeting $4 if the breakout happens
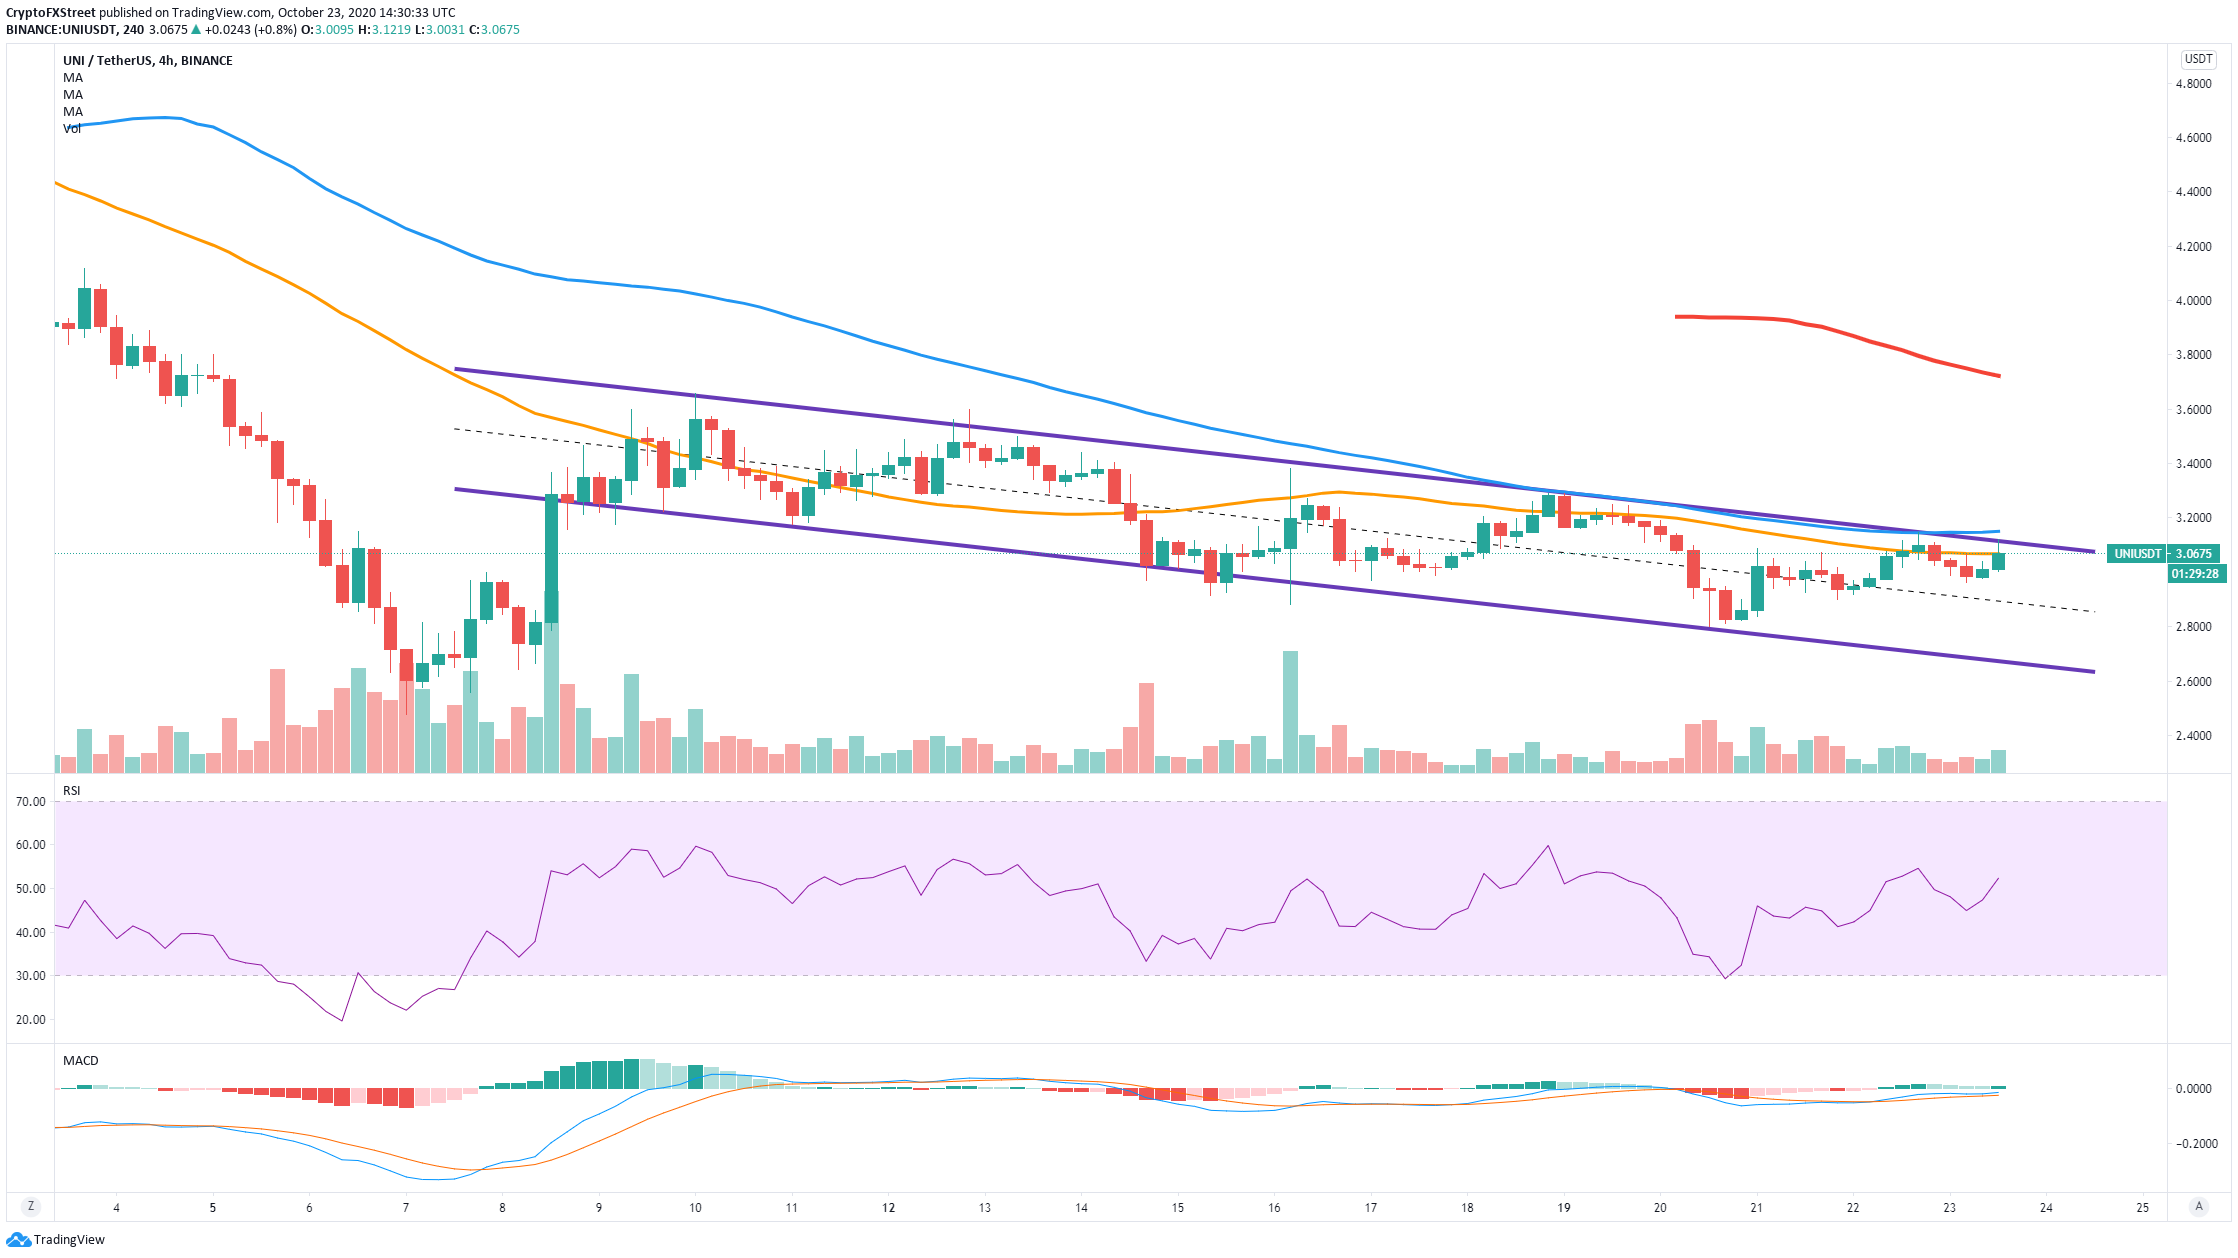
On the 4-hour chart, the most significant pattern formed is the descending parallel channel with its upper boundary at $3.1, which represents a critical resistance level. Bulls are also fighting to push UNI above the 50-SMA at $3.06.
UNI/USDT 4-hour chart
The MACD remains bullish, and it’s gaining momentum again after a brief period of consolidation. A breakout above the critical level at $3.1 has the potential to drive the price of UNI towards the psychological level at $4.
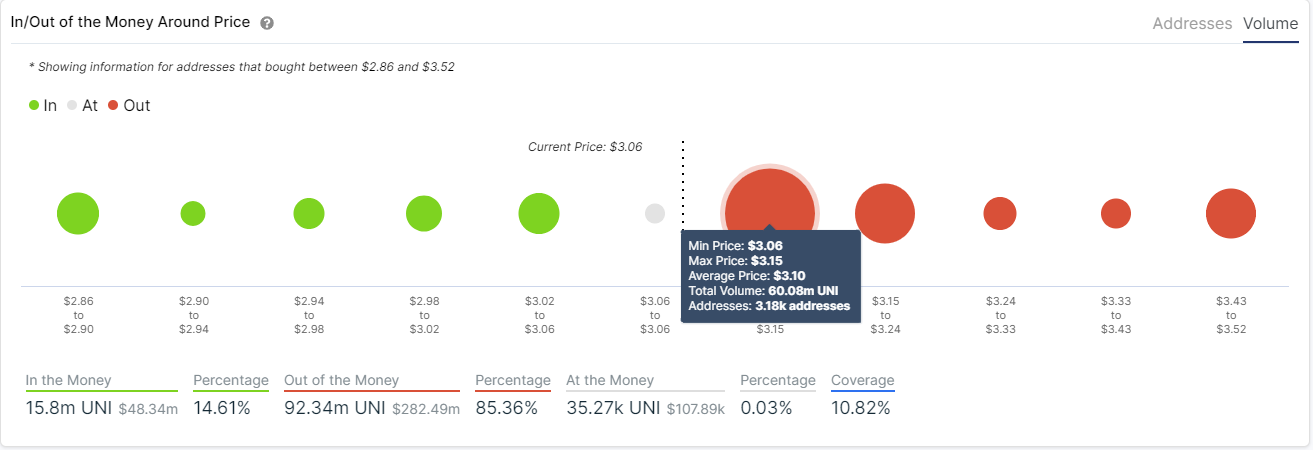
UNI IOMAP Chart
The In/Out of the Money Around Price chart seems to confirm this theory showing a vital resistance area between $3.06 and $3.15, but very little resistance above, in comparison. It also looks like the network growth of Uniswap has formed a double bottom with a resistance level of around 2,125.
UNI Network Growth Chart
 [16.29.22, 23 Oct, 2020]-637390606437116624.png)
Rising above this level would add fuel to the bullish breakout. On top of that, the holder’s distribution chart shows whales are very interested in UNI. The number of holders with at least 10,000,000 coins ($30,000,000 at current prices) has increased by two during this month.
UNI Holders Chart
 [16.32.55, 23 Oct, 2020]-637390605933599545.png)
The other side of the fence
Despite the recent bullish momentum, rejection from the critical resistance level at $3.1 can easily push the digital asset down to the psychological level at $3. The same IOMAP chart above shows very little support below in comparison to $3.1.
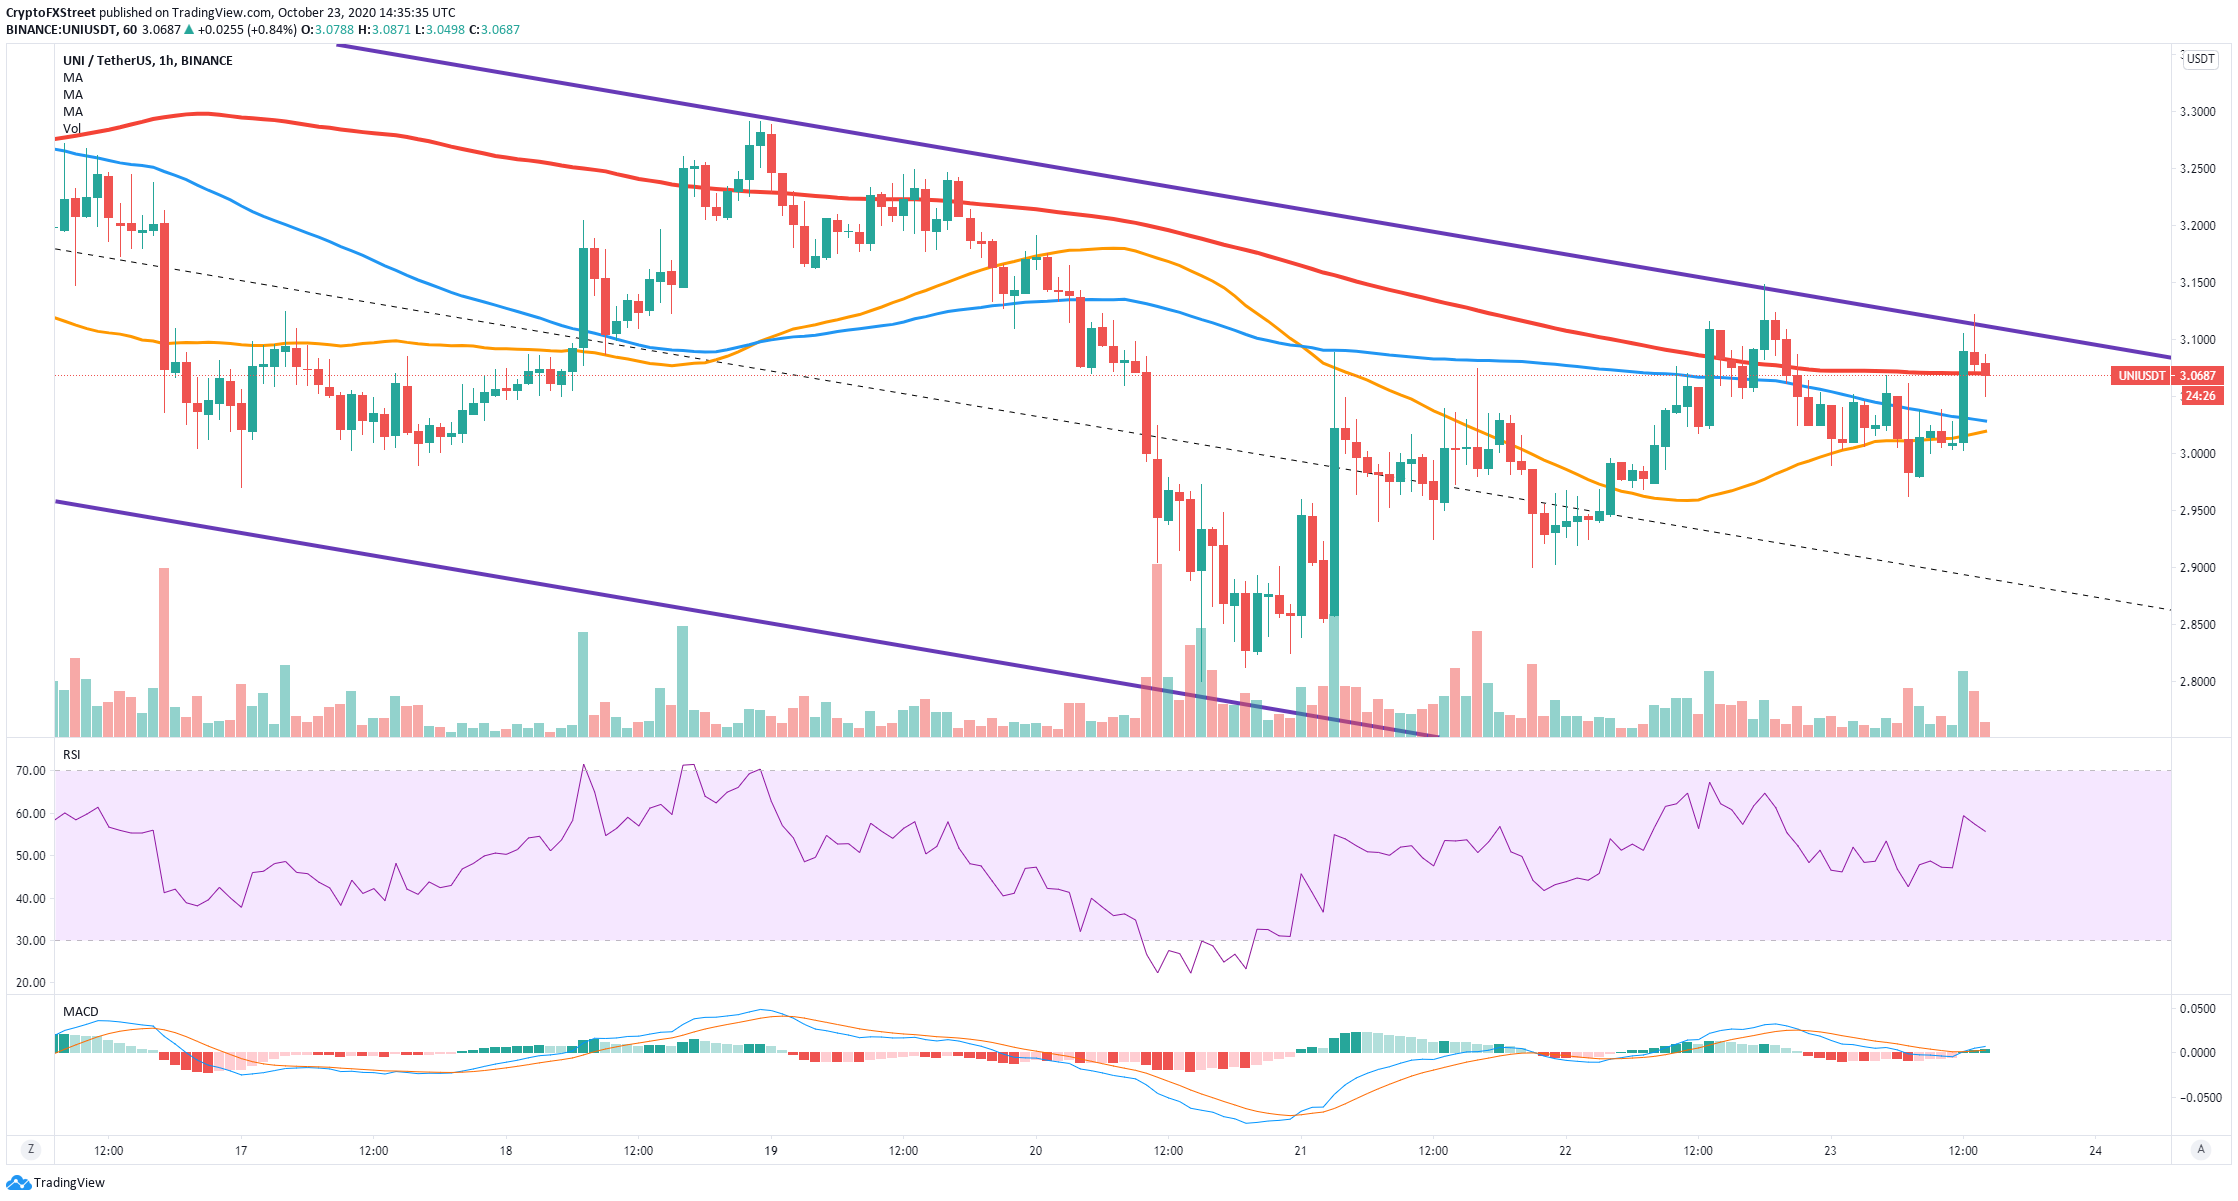
UNI/USDT 1-hour chart
The price of UNI is having trouble staying above the 200-SMA. Falling below this resistance level could drive it towards $3, where the 50-SMA and the 100-SMA coincide. A lower price target would be $2.88, the middle trendline of the descending parallel channel.
Information on these pages contains forward-looking statements that involve risks and uncertainties. Markets and instruments profiled on this page are for informational purposes only and should not in any way come across as a recommendation to buy or sell in these assets. You should do your own thorough research before making any investment decisions. FXStreet does not in any way guarantee that this information is free from mistakes, errors, or material misstatements. It also does not guarantee that this information is of a timely nature. Investing in Open Markets involves a great deal of risk, including the loss of all or a portion of your investment, as well as emotional distress. All risks, losses and costs associated with investing, including total loss of principal, are your responsibility. The views and opinions expressed in this article are those of the authors and do not necessarily reflect the official policy or position of FXStreet nor its advertisers.