TRON’s TRX price can advance further with this bullish formation
|
- Tron price sees a fierce leg higher this morning as the bulls take out two resistances.
- TRX price is set to rally towards the next technical hurdle if bulls can close above the current one.
- Expect a whopping 40% gains in case tail risks keep diminishing.
Tron (TRX) price is breaking bears and seeing them flee the scene this morning as bulls take out two key resistance elements during the ASIA PAC and European trading sessions. If bulls can keep the pressure on this rally, and get a daily close above the 200-day Simple Moving Average (SMA), it will confirm an uptrend is in progress with more upside potential. The target for this week is the ultimate double top at $0.0925 with 40% gains in the making.
Tron price set to confirm uptrend
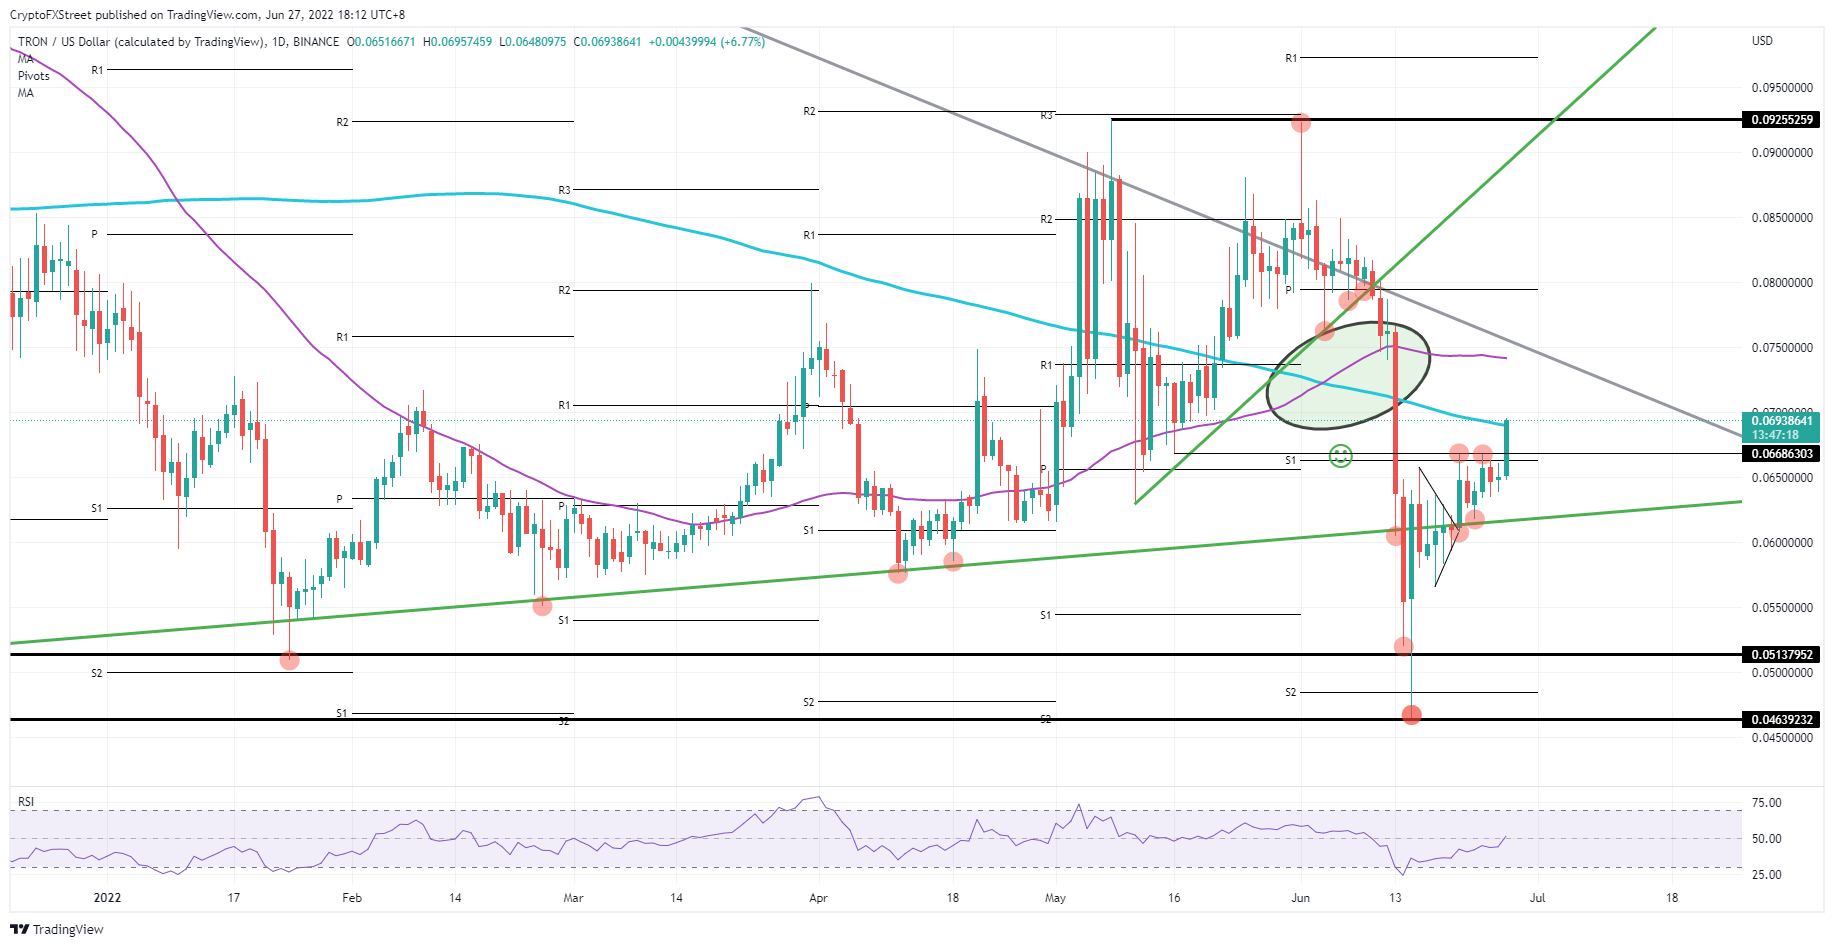
Tron price is currently printing over 6% gains as traders storm out of the gates after price action broke above the twin hurdle of the double top and the low of May 16 at $0.0668. The higher lows thus formed have squeezed bears against that upper level and seen them get stopped out of their positions today. With price action now breaking above the 200-day SMA at $0.0690, an uptrend will probably be confirmed, whilst a golden cross further underpins the bullish outlook.
TRX price will need to close above the 200-day SMA to further strengthen the bullish signal as this is a more essential and longer-term technical moving average. What usually comes next is a pop higher towards the 55-day SMA to play the spread in between, nearly hitting $0.075 in the process. Should all the stars align and global markets rally throughout the week – with equities creeping out of their bear market pattern too – expect to see $0.09255 hit, possibly by this weekend, printing a solid 40% gain in the process and a new uptrend reversal given the stamp of approval for the coming summer.
TRX/USD daily chart
As price action is already elevated today, and bulls that are only joining now, on the break of the 200-day SMA, could be pulled into a bull trap. If so, price action could start to reverse near the US closing bell, trapping bulls in their long positions in the process, and leading to losses. A complete pairing back to $0.0668 support could see most buyers bail as losses start to pile up.
Information on these pages contains forward-looking statements that involve risks and uncertainties. Markets and instruments profiled on this page are for informational purposes only and should not in any way come across as a recommendation to buy or sell in these assets. You should do your own thorough research before making any investment decisions. FXStreet does not in any way guarantee that this information is free from mistakes, errors, or material misstatements. It also does not guarantee that this information is of a timely nature. Investing in Open Markets involves a great deal of risk, including the loss of all or a portion of your investment, as well as emotional distress. All risks, losses and costs associated with investing, including total loss of principal, are your responsibility. The views and opinions expressed in this article are those of the authors and do not necessarily reflect the official policy or position of FXStreet nor its advertisers.
