Top Three Coins Price Prediction: Bitcoin, Ethereum and Ripple bulls take control but face key resistance levels on the upside
|
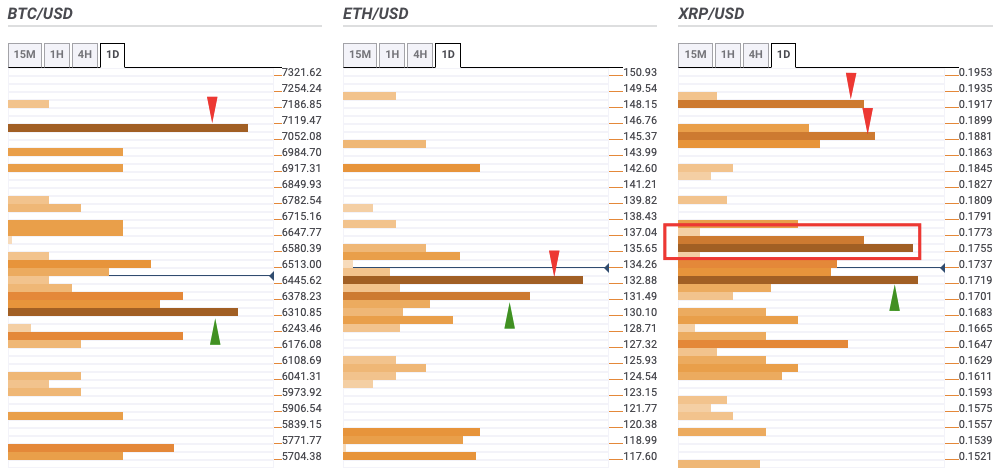
Top Three Coins Confluence Detector
Bitcoin
BTC/USD rose from $6,406.30 to $6,450 so far this Tuesday. The bulls face no noticeable resistance to $7,000. Following that, they will need to overcome resistance at $7,100 to go past the $7,300–level. The $7,100–level has the one-day and one-month Pivot Points. On the downside, there is healthy support at $6,350, which has the 4-hour Bollinger Band.
Key Levels
Ethereum
ETH/USD rose from $132.48 to $132.32 this Tuesday. Quite like BTC/USD, ETH/USD also has one healthy support and resistance level. The $133.50 resistance level has the one-hour and 4-hour Previous Low, SMA 5, SMA 10, SMA 50, SMA 100 and one-day Fibonacci 23.6% retracement level. On the downside, the $132 support level has the one-day Bollinger Band, one-day Fibonacci 38.2% retracement level and 4-hour Bollinger Band.
Key Levels
Ripple
XRP/USD has gone up from $0.1715 to $0.1723 but faces significant resistance levels up ahead at $0.1765-$0.177, $0.189 and $0.1925. The $0.1765-$0.177 stack has the 4-hour and one-day Previous Lows, one-hour Bollinger Band and Previous Year low. $0.189 has the Previous Week high and $0.1925 has the one-day Pivot Point resistance-three and one-day Bollinger Band. On the downside, healthy support lies at $0.1720, which has the SMA 50, one-hour Bollinger Band and one-week Fibonacci 38.2% retracement level.
Key Levels
Information on these pages contains forward-looking statements that involve risks and uncertainties. Markets and instruments profiled on this page are for informational purposes only and should not in any way come across as a recommendation to buy or sell in these assets. You should do your own thorough research before making any investment decisions. FXStreet does not in any way guarantee that this information is free from mistakes, errors, or material misstatements. It also does not guarantee that this information is of a timely nature. Investing in Open Markets involves a great deal of risk, including the loss of all or a portion of your investment, as well as emotional distress. All risks, losses and costs associated with investing, including total loss of principal, are your responsibility. The views and opinions expressed in this article are those of the authors and do not necessarily reflect the official policy or position of FXStreet nor its advertisers.