Top dog-theme meme coins WIF, BONK, FLOKI: Double-digit gains on the horizon
|
- Dogwifhat, Bonk and FLOKI registered gains of more than 20% last week.
- The three dog theme-based meme coins hover around key levels, signaling the possibility of further gains ahead.
- The RSI nears overbought levels for WIF, BONK and FLOKI, increasing the odds of a corrective pullback.
The prices of top trending dog-theme-based meme coins, Dogwifhat (WIF), Bonk (BONK) and FLOKI (FLOKI), hold gains on Monday after prices increased more than 20% last week. The technical outlook suggests that the bulls still have steam to push these three meme coins for extra double-digit gains.
Dogwifhat bulls remain strong
Dogwifhat price broke above the descending trendline and closed above the daily resistance level at $1.947 on September 24, rallying 23% over the next four days. On Monday, it trades slightly down, around $2.413.
If WIF closes above its 50% price retracement at $2.586, it could extend its rally by 12% to retest the July 22 high of $2.895.
The Relative Strength Index (RSI) stands at 74, trading above its overbought level of 70. Traders should be cautious because the chances of a price pullback are increasing, particularly as the RSI tilts down. If it exits overbought territory, it would give a clear selling signal. Another possibility is that the rally continues, and the RSI remains above the overbought level.
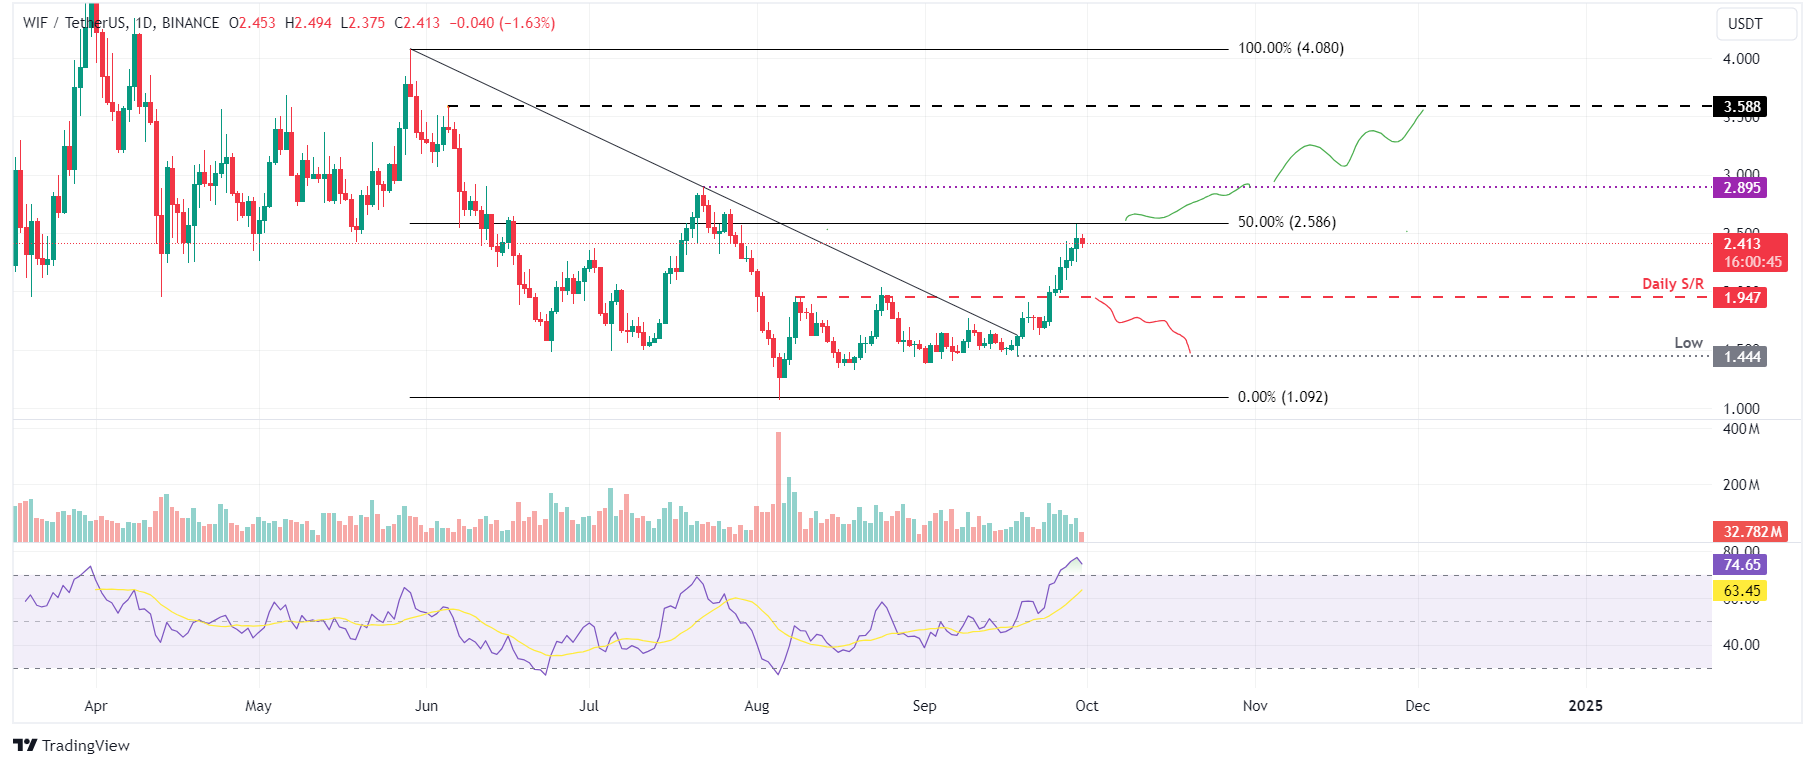
WIF/USDT daily chart
On the other hand, if WIF fails to close below its 50% price retracement at $2.586 and declines down, closing below the daily support at $1.947. This price action could extend the decline to retest the September 18 low of $1.444.
Bonk price shows potential for a rally
Bonk price broke above the descending trendline (drawn from the end of May to the end of September) on Friday and rallied 15% to close above the daily resistance level at $0.0000228. On Monday, it trades slightly higher at around $0.0000242.
If the $0.0000228 holds as support, BONK could rally 19% from its current trading level to retest its 50% price retracement level at $0.000030 (drawn from May high to August low).
The RSI has bounced back, trading above the overbought level of 70 and pointing upwards, suggesting that bulls still have a stem for the upward rally. However, traders should note that the RSI at these levels increases the chances of a price pullback.
BONK/USDT daily chart
If BONK closes below $0.0000228, it could extend the decline to retest its September 17 low of $0.0000181.
FLOKI price looks promising
FLOKI's price broke on Friday above its daily resistance level at $0.000154, which coincides with the 50% price retracement level, and rallied 12.5%. On Monday, it trades slightly above, its $0.000154 key support level.
If the $0.000154 support level holds, FLOKI could rally 21% to retest its July 27 high of $0.000188.
The RSI is trading down from its overbought level of 70, suggesting a decrease in bullish momentum. Still, the momentum indicator stays broadly stable at 66, suggesting bulls remain strong.
FLOKI/USDT daily chart
Conversely, if FLOKI closes below the $0.000154 support level, it could extend the decline to retest its September 26 low of $0.000135.
Information on these pages contains forward-looking statements that involve risks and uncertainties. Markets and instruments profiled on this page are for informational purposes only and should not in any way come across as a recommendation to buy or sell in these assets. You should do your own thorough research before making any investment decisions. FXStreet does not in any way guarantee that this information is free from mistakes, errors, or material misstatements. It also does not guarantee that this information is of a timely nature. Investing in Open Markets involves a great deal of risk, including the loss of all or a portion of your investment, as well as emotional distress. All risks, losses and costs associated with investing, including total loss of principal, are your responsibility. The views and opinions expressed in this article are those of the authors and do not necessarily reflect the official policy or position of FXStreet nor its advertisers.