Top 3 Price Prediction Bitcoin, Ethereum, XRP: Crypto profit-taking starts before new uptrend
|
- Bitcoin price halted against crucial resistance zone.
- Ethereum price pauses shy of the critical $3,300 value area.
- XRP price drops 10% from the Tuesday high and still outperforms BTC and ETH this week.
Bitcoin price action faced expected profit-taking and resistance at the $45,000 value area. Ethereum price, like Bitcoin, faces some profit-taking after a significant recovery rally. XRP price gained more than 21% on Monday.
Bitcoin price downside risks are limited to the $41,000 value area
Bitcoin price faced immediate and intense selling pressure after hitting the 50% Fibonacci retracement at $45,435. Selling pressure continued through the Tuesday trading day, with support found near the top of the weekly Ichimoku Cloud (Senkou Span A) at $43,000. The level at $43,000 also contains the weekly Tenkan-Sen, creating a solid immediate support zone with a high probability of holding.
The daily chart warns that Bitcoin’s near-term price action is overbought and could hint at lower prices – even a bearish continuation. However, the weekly chart shows conditions are still very oversold and that a breakout towards the $50,000 is still underway.
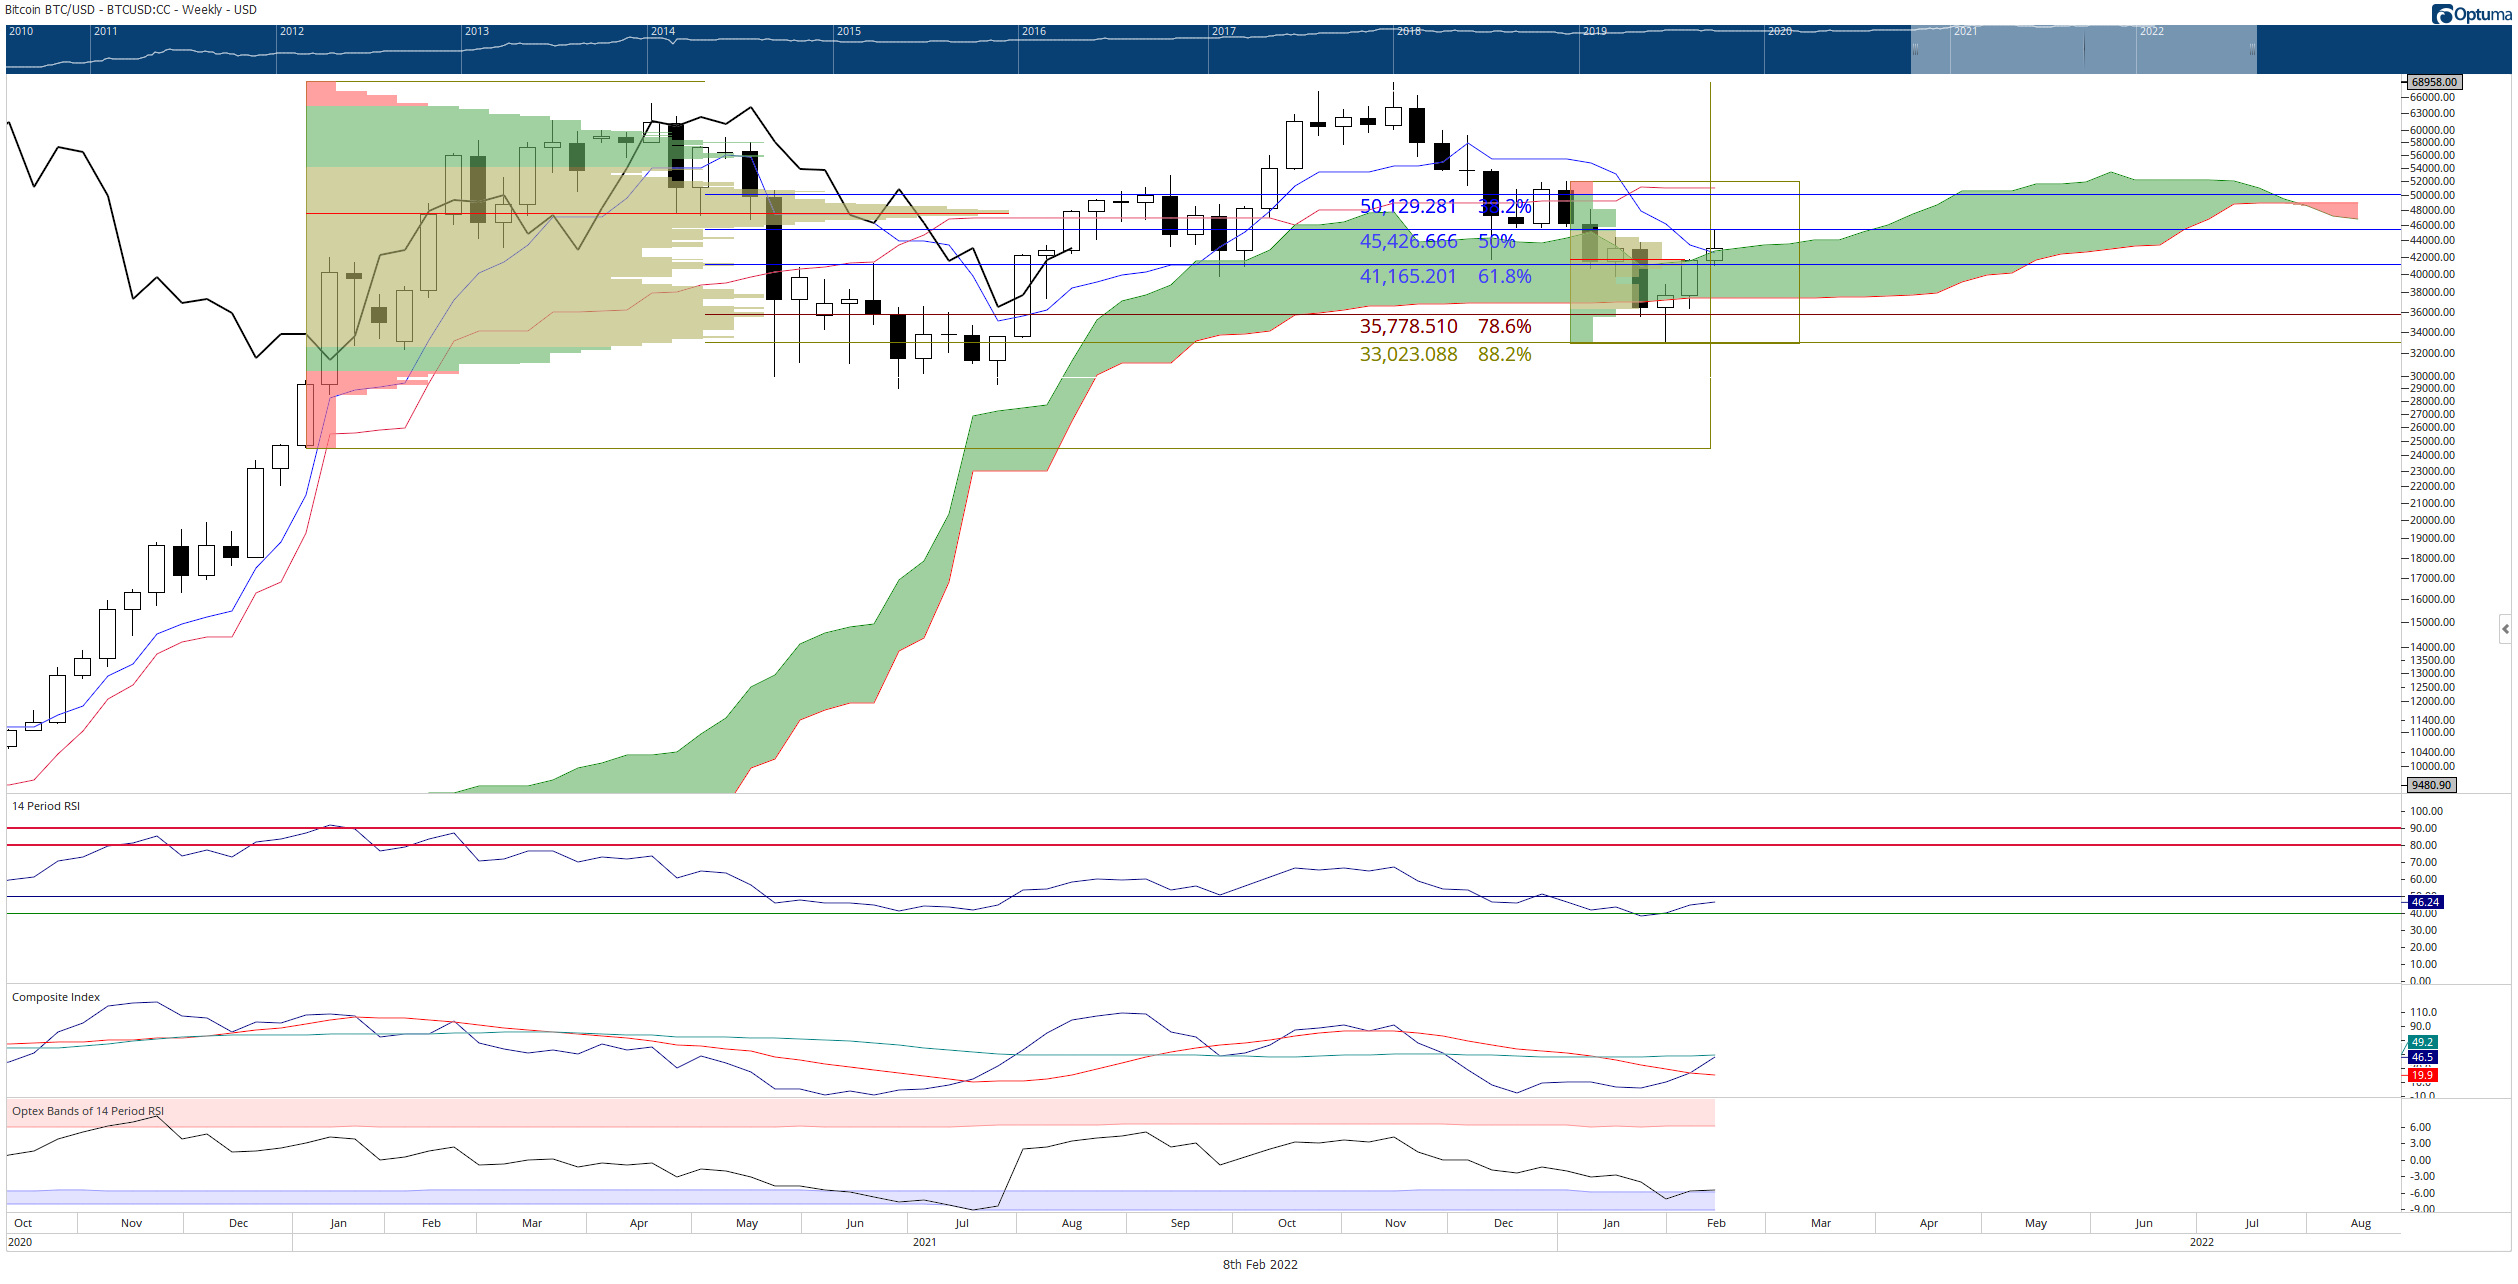
BTC/USD Weekly Ichimoku Kinko Hyo Chart
If $43,000 fails to hold as support, the following primary support structure is the 2022 Volume Point Of Control and the 61.8% Fibonacci retracement at $41,200. Therefore, Bitcoin price will need to maintain that value area, or it will face a strong sell-off towards the $37,400 value area.

Ethereum price likely to test $3,000 as support
Ethereum price action, like the majority of the cryptocurrency market, is facing some selling pressure against crucial resistance levels or severely overbought oscillator conditions on the daily chart. A likely pullback zone that Ethereum would find support is the daily Tenkan-Sen and 50% Fibonacci retracement in the $2,900 to $3,000 value area.
If the $2,900 to $3,000 value area holds as support, it should provide the base necessary to return Ethereum price into the last bull flag in the $3,500 value area. The primary goal that bulls need to achieve is a daily candlestick close above the Ichimoku Cloud and where the Chikou Span is above the candlestick bodies and in open space. Today, the earliest this could occur is at the $3,800 value area – but by February 20, that threshold drops to $3,200.
ETH/USD Daily Ichimoku Kinko Hyo Chart
Downside risks for Ethereum price should be limited to the 61.8% Fibonacci retracement at $2,500.

XRP price action outshines BTC and ETH
XRP price had some spectacular bullish performance on Monday. It gained nearly 23% from the open to the high and closed Monday’s candlestick with a nearly 22% gain. The significance of this move should not be understated. It is the single largest, bullish daily close since April 26, 2021, when XRP had a close of nearly 32%. In addition, it was the most significant bullish daily close since the beginning of the current downtrend on September 6, 2021.
Bulls attempted to push XRP price higher by reaching the $0.915 level – but XRP promptly sold off. XRP has returned to the Tuesday open, representing a 10% drop from the intraday high. It is now in between an extremely tight range of support and resistance. Support for XRP is the Ichimoku Cloud at $0.825 and resistance at the 38.2% Fibonacci retracement at $0.840.
XRP/USD Daily Ichimoku Kinko Hyo Chart
Failure to hold support against the Ichimoku Cloud will likely result in a test of the Tenkan-Sen and Kijun-Sen in the $0.750 value area. However, if support above the Cloud holds, a return to $1 is all but a foregone conclusion. More importantly, a daily close above the Cloud would confirm an Ideal Bullish Ichimoku Breakout – the first occurrence of that bullish entry signal since November 2021.

Information on these pages contains forward-looking statements that involve risks and uncertainties. Markets and instruments profiled on this page are for informational purposes only and should not in any way come across as a recommendation to buy or sell in these assets. You should do your own thorough research before making any investment decisions. FXStreet does not in any way guarantee that this information is free from mistakes, errors, or material misstatements. It also does not guarantee that this information is of a timely nature. Investing in Open Markets involves a great deal of risk, including the loss of all or a portion of your investment, as well as emotional distress. All risks, losses and costs associated with investing, including total loss of principal, are your responsibility. The views and opinions expressed in this article are those of the authors and do not necessarily reflect the official policy or position of FXStreet nor its advertisers.