Top 3 Price Prediction Bitcoin, Ethereum, XRP: Crypto markets hold off sellers as bulls keep charging
|
- Bitcoin price hits new 2022 highs and turns positive for the year.
- Ethereum price looks strong as it approaches $3,500.
- XRP price shakes off Monday’s end-of-session sell-off to continue higher.
Bitcoin price keeps pushing higher, denying bears their selling opportunities. Ethereum price may not stop until it hits $4,000. XRP price continues to move towards $1.
Bitcoin price may hit $60,000 before pulling back
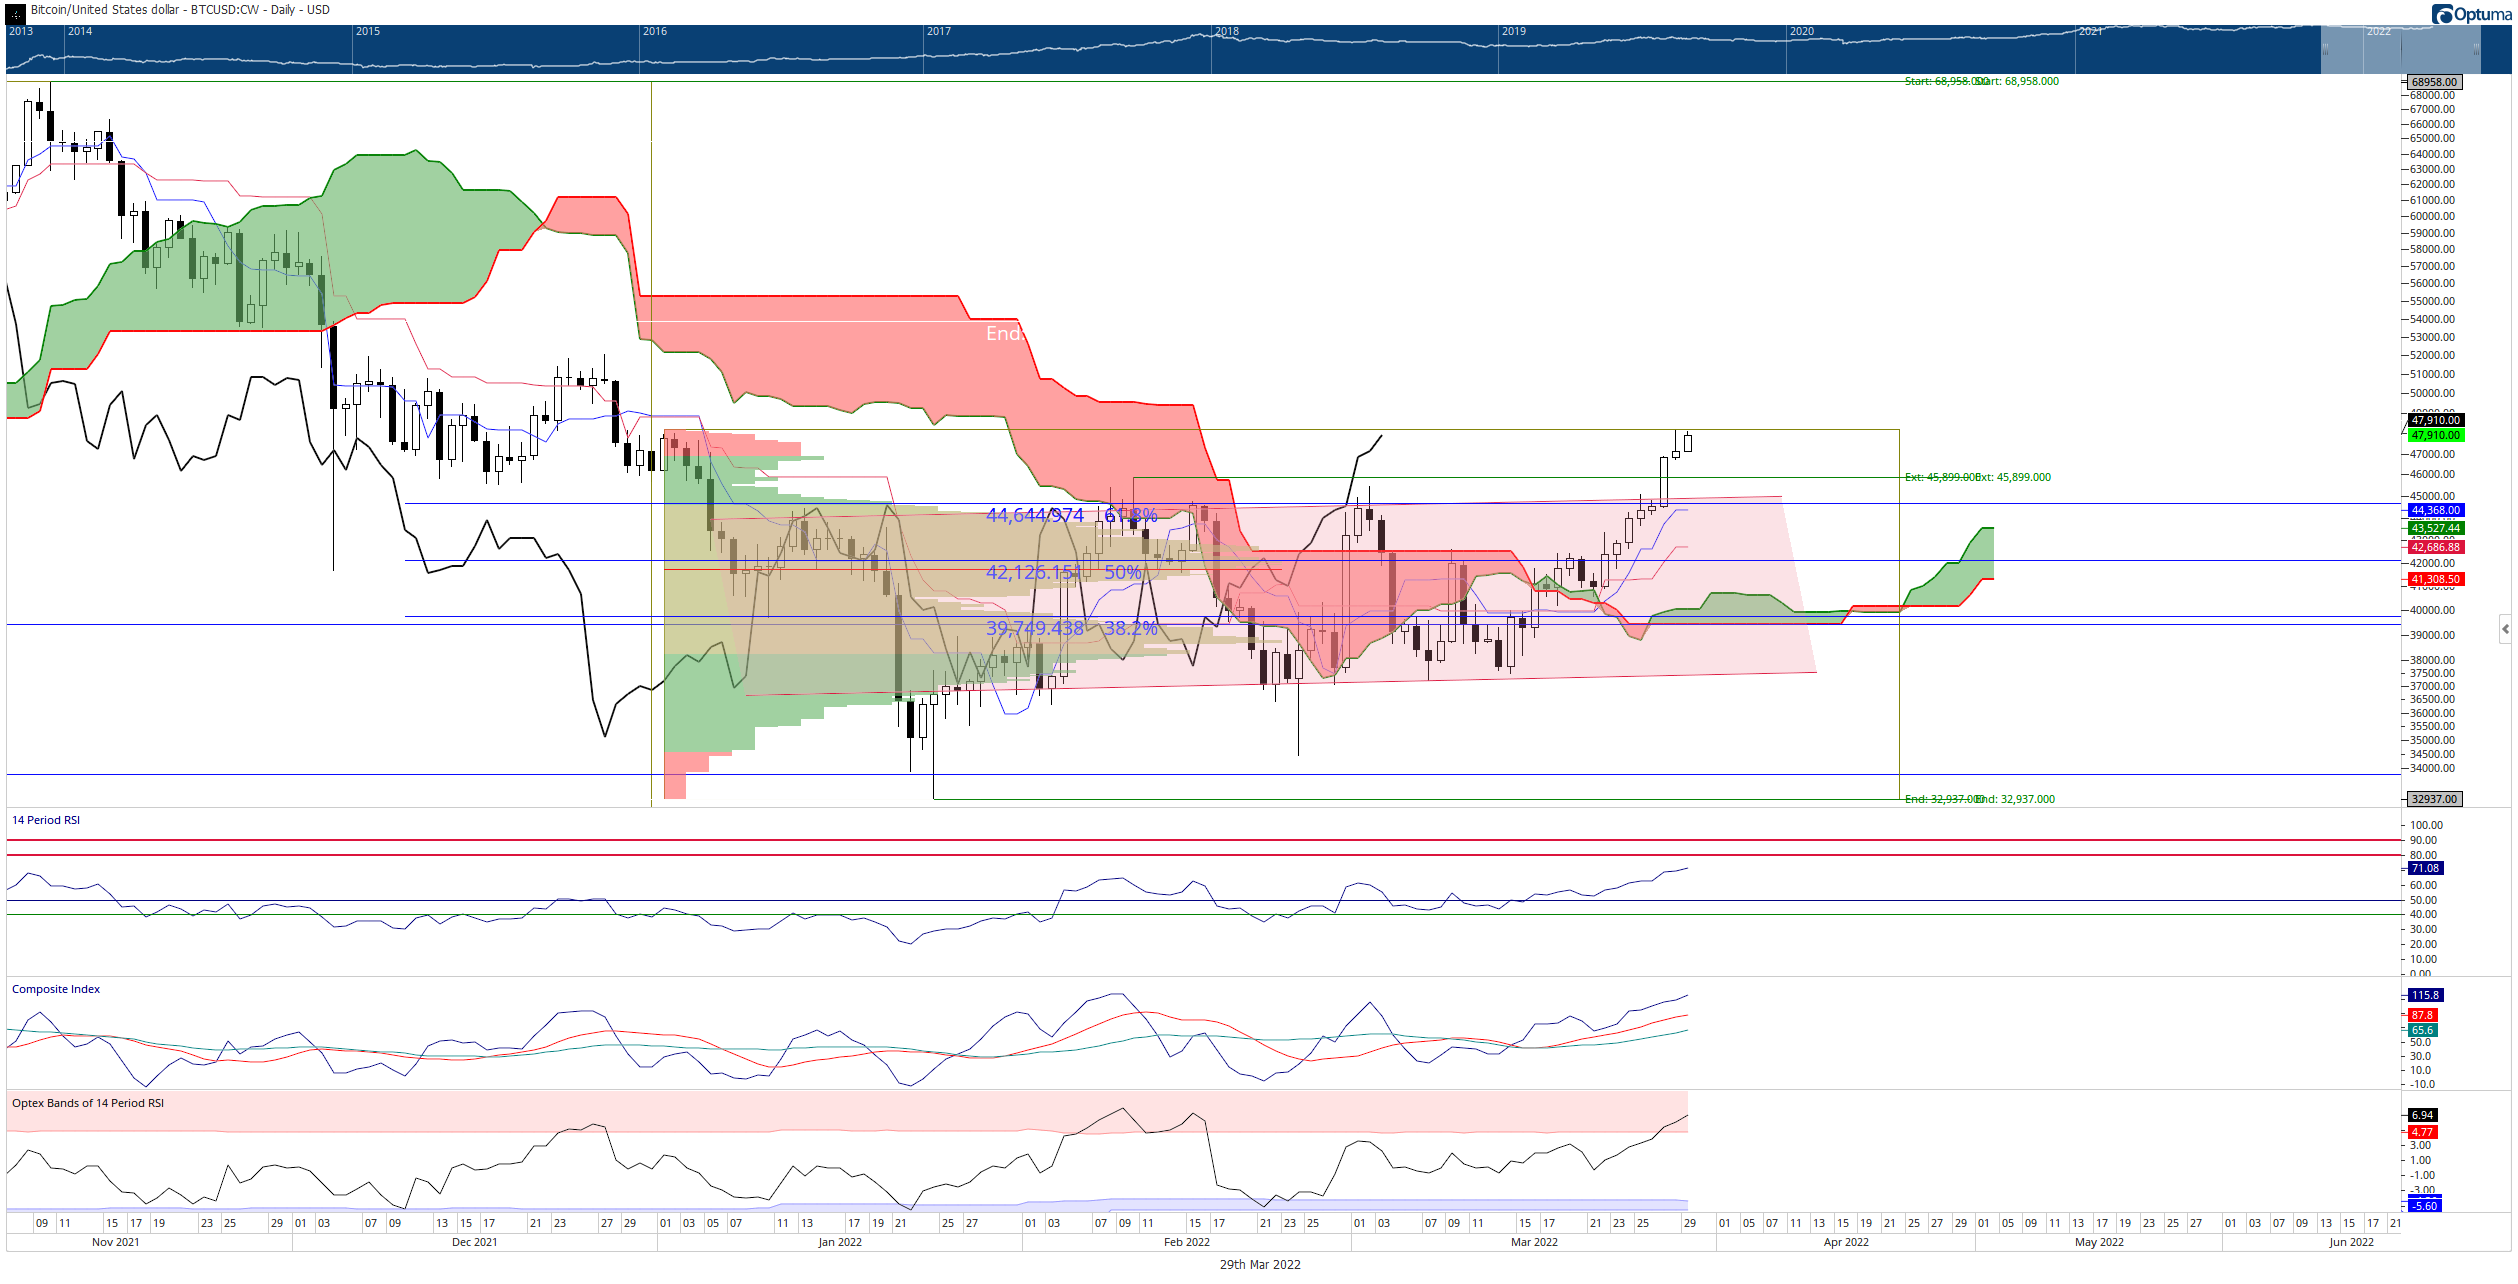
Bitcoin price action has been in massive bullish rise over the past few weeks that bulls and bears alike expect a pullback. However, that may not occur. Bitcoin has already made new 2022 highs, and if it has a daily close that puts BTC positive for 2022, that could trigger some major institutional positioning.
Institutions often look for yearly highs and lows to be established in January and July – if an instrument is trading above the January open, positions are frequently bought, added, and supported. If an instrument is below the January open, positions are often sold and reduced. However, when a ceiling is broken, institutions often switch the position management to turn that ceiling into a new floor.
In other words, if institutional participation displays historically normal behavior and positioning, then Bitcoin price may see the $47,500-to-$48,000 price range as the new 2022 ‘low’ until July. The next price zone to test as resistance is the $50,000 value area in that scenario.
BTC/USD Daily Ichimoku Kinko Hyo Chart
However, confirmation is needed to make sure there is a change in institutional positioning. There is a strong likelihood that Bitcoin price and the broader cryptocurrency market may experience some profit taking for the remainder of the week. Bitcoin price would likely return to the breakout of the bear flag at $44,725, where the daily Tenkan-Sen ad 61.8% Fibonacci retracement currently exist.
Ethereum price faces a big test at $3,500, which may create a bear trap
Ethereum price completed an Ideal Bullish Ichimoku Breakout last Wednesday (March 23, 2022) for the first time since October 13, 2021. It is only the second confirmed Ideal Bullish Ichimoku Breakout since August 4, 2021, and the third since November 5, 2020.
The first resistance zone was the 38.2% Fibonacci retracement at $3,300, which ETH closed above on Sunday. The next major resistance level is $3,500, where the weekly Kijun-Sen and 100% Fibonacci expansion exist. Bulls and bears alike anticipate profit-taking at $3,500, but that may not occur.
The daily Relative Strength Index remains in bull market conditions and is not yet at the first overbought level of 80. This suggests that Ethereum price could continue to push higher to at least the $3,800 value area. But even if that occurs, buying pressure may not cease. The weekly Relative Strength Index is just coming out of a long congestion zone of trading between the oversold levels of 40 and 50 since the beginning of 2022.
ETH/USD Weekly Ichimoku Kinko Hyo Chart
Upside potential could extend as high as the 161.8% Fibonacci expansion at $4,550. Downside risks are likely limited to the bottom of the bull flag and top of the Ichimoku Cloud (Senkou Span A) at $3,175.
XRP price action likely trapped many short sellers after Monday’s close
XRP price action experienced a big whipsaw on Monday, gaining as much as 5.5% before losing the majority of those gains to settle at a modest 0.8% gain. The candlestick that developed is a naturally bearish one that likely enticed some short sellers to open new positions. However, that may have been the intention, especially given XRP’s behavior with the Tenkan-Sen.
One of the most critical warnings within the Ichimoku Kinko Hyo system is to avoid trading against an instrument trending in tandem with the Tenkan-Sen – sometimes referred to as holding hands due to how close they are. XRP has steadily moved higher over the past two weeks, with price and the Tenkan-Sen remaining very close together. Behavior that is likely to continue.
XRP/USDT Daily Ichimoku Kinko Hyo Chart
From an Ichimoku perspective, there is little in the form of resistance to prevent XRP price from revisiting the $1 value area. Additionally, downside risks should be limited to the $0.70-to-$0.75 price ranges.
Information on these pages contains forward-looking statements that involve risks and uncertainties. Markets and instruments profiled on this page are for informational purposes only and should not in any way come across as a recommendation to buy or sell in these assets. You should do your own thorough research before making any investment decisions. FXStreet does not in any way guarantee that this information is free from mistakes, errors, or material misstatements. It also does not guarantee that this information is of a timely nature. Investing in Open Markets involves a great deal of risk, including the loss of all or a portion of your investment, as well as emotional distress. All risks, losses and costs associated with investing, including total loss of principal, are your responsibility. The views and opinions expressed in this article are those of the authors and do not necessarily reflect the official policy or position of FXStreet nor its advertisers.


