Top 3 Price Prediction Bitcoin, Ethereum, XRP: Crypto market prepares to spring bear trap
|
- Bitcoin price likely to fake-out traders expecting a seasonal/cyclical price collapse.
- Ethereum price quietly converts to a bull market on the Point and Figure chart.
- XRP price dependent on Ethereum and Bitcoin for directional bias.
Bitcoin price action completes six weeks in a corrective move, the second-longest corrective period of 2021. Ethereum price has shifted momentum, likely trapping traders who utilize Japanese candlesticks exclusively. XRP price action is stagnant and likely awaits a clear directional move from Bitcoin and Ethereum.
Bitcoin price shows early signs of a new uptrend, likely disappointing many short-sellers
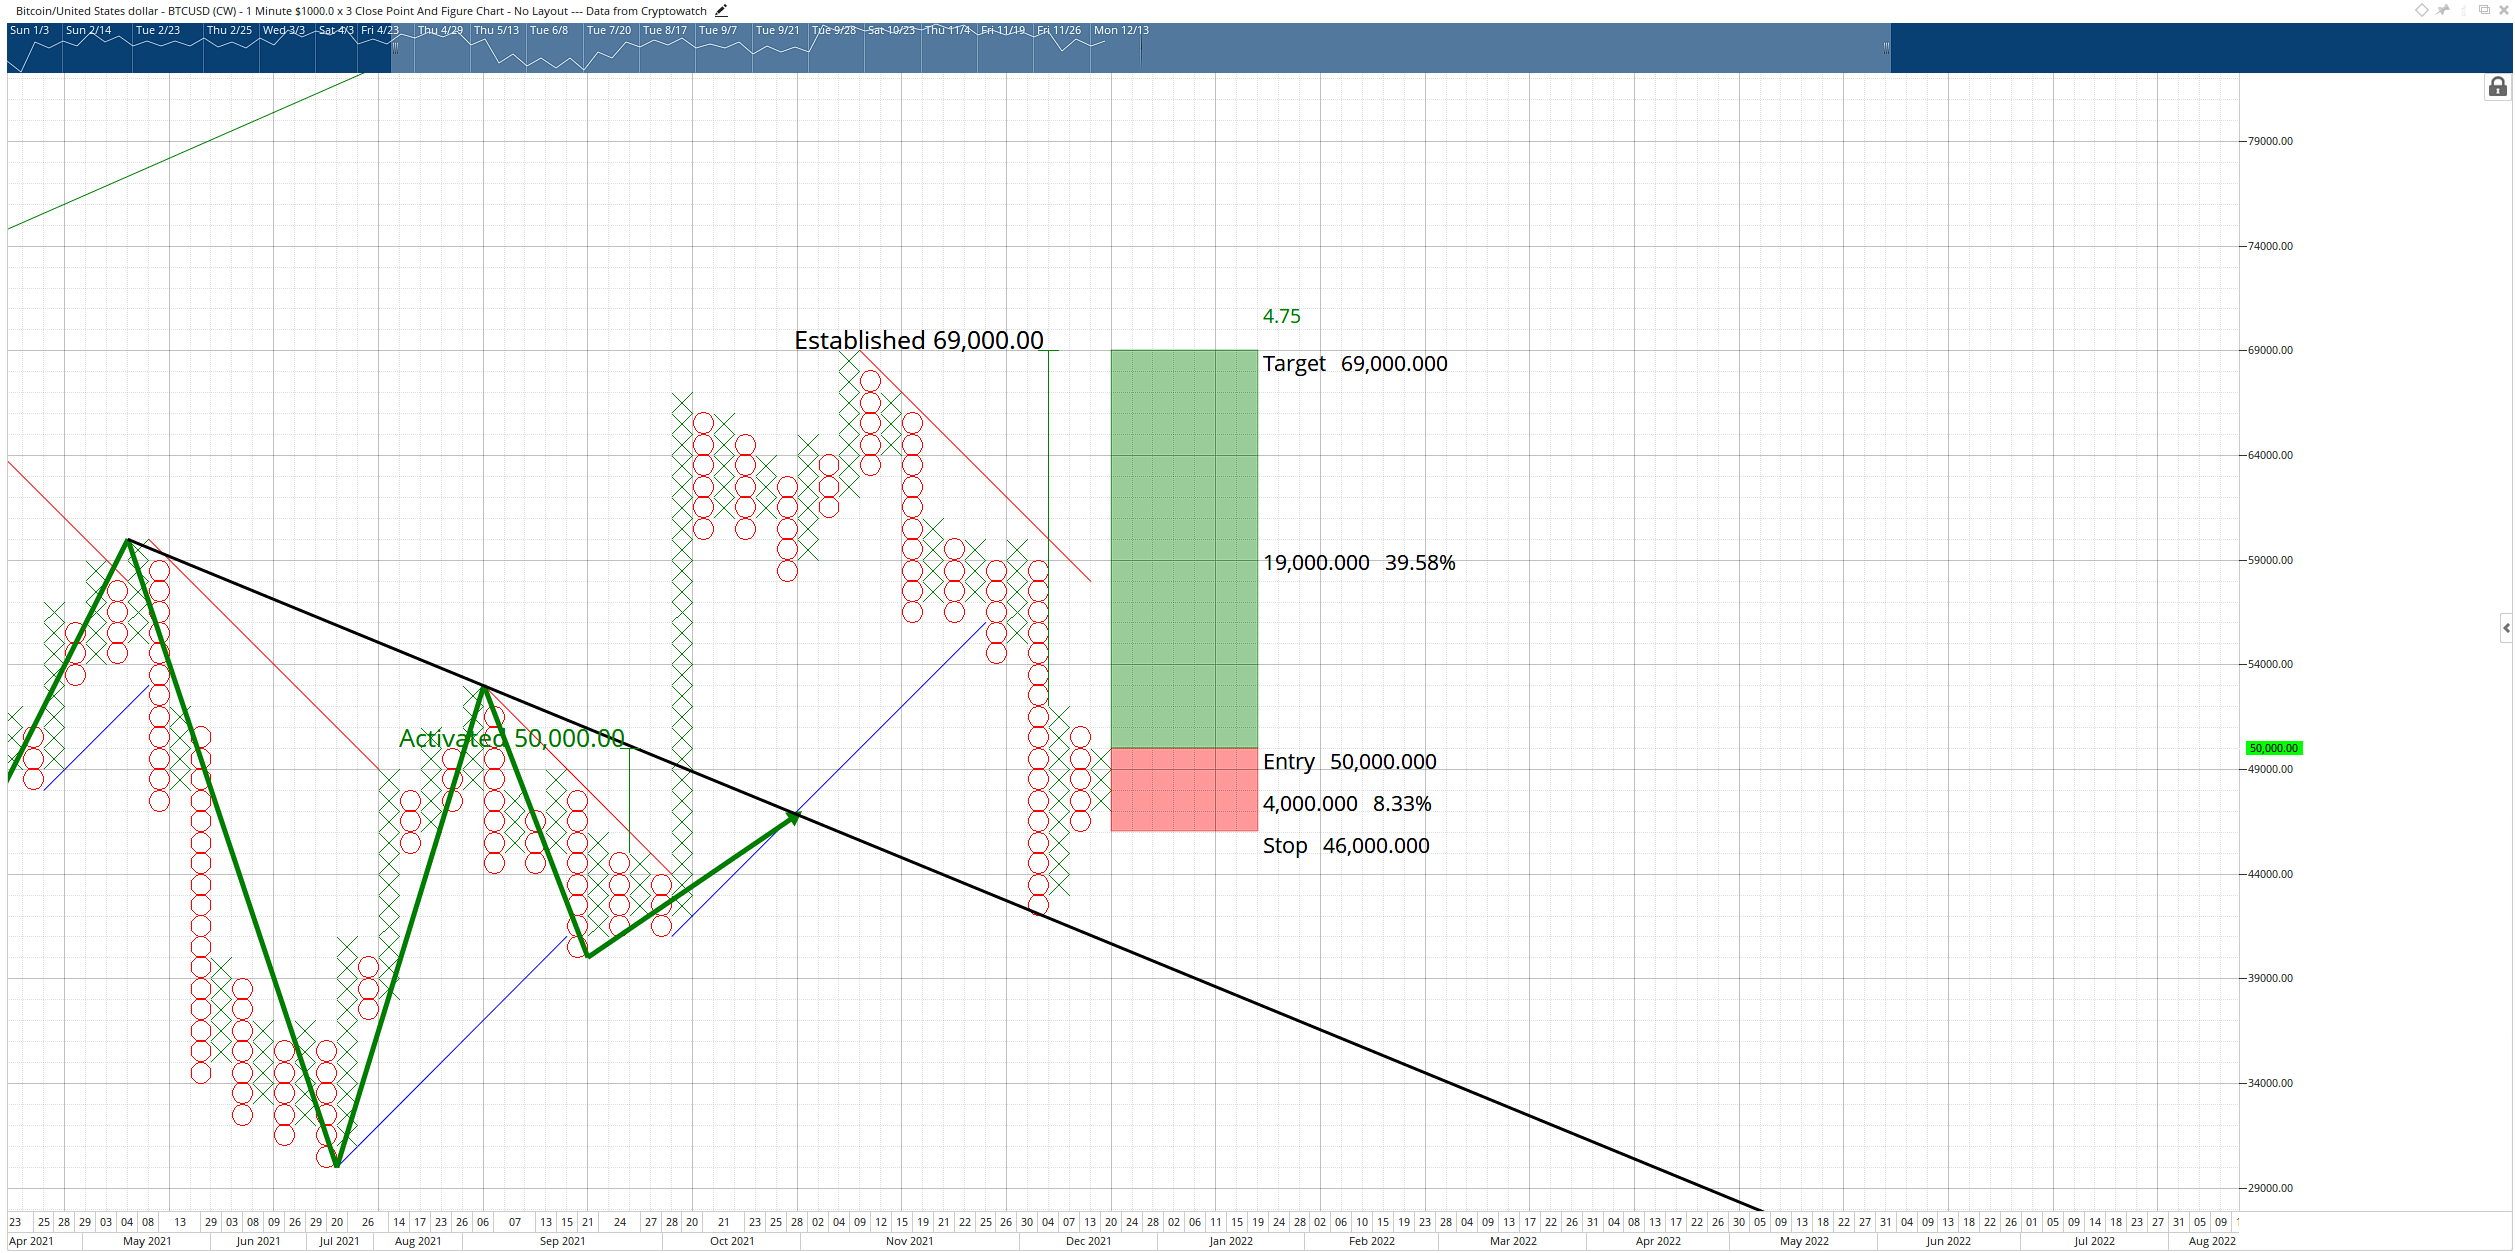
Bitcoin price has begun the process of converting from a bear market on the $1,000/3-box Point and Figure chart to a bull market. The flash crash of December 5th brought Bitcoin to a low that was precisely on the neckline of a prior inverse head and shoulder pattern. The resulting price action has created an opportunity for a long entry.
BTC/USD $1,000/3-box Reversal Point and Figure Chart
The hypothetical long entry is a buy stop order at $50,000, a stop loss at $46,000, and a profit target at $69,000. A two to three-box trailing stop would help protect any implied profits after the entry. This trade is invalidated if Bitcoin price drops to $40,000 before the entry would trigger.
Ethereum price action likely to trap bears
Ethereum price has shifted into a bull market after breaking above the prior bear market trendline at $4,150. This conversion leads the Japanese candlestick chart, which still shows a mix of bearish to neutral conditions. This development has generated a theoretical long opportunity for Ethereum.
The theoretical long entry is a buy stop order at $4,000, a stop loss at $3,750, and a profit target at $5,600. The long entry would be the first entry after the pullback from the conversion. This is a sign of significant strength on a Point and Figure chart.
ETH/USD $50/3-box Reversal Point and Figure Chart
However, downside risks remain. Ethereum price must maintain a support level above the $3,700, or the current Point and Figure chart will return to bear market conditions. If that occurs, then Ethereum will likely return to the $2,800 - $3,000 value areas.
XRP price stuck in a tight range, directional bias unclear
XRP price has made little effort over the past ten trading days to establish a clear direction move beyond consolidation. It has developed strong support and range structure between the $0.75 to $0.80 price ranges. When compared to past XRP analysis, not much has changed.
The $0.05/3-box reversal Point and Figure chart shows the same pattern entry reviewed in past weeks. A hypothetical long entry would occur on the three-box reversal with a buy stop at $1.00, a stop loss at $0.80, and a profit target at $1.70. This trade idea has no invalidation point because the entry would trail further downside movement.
XRP/USDT $0.05/3-box Reversal Point and Figure Chart
If XRP bulls wish to prevent further downside movement, buyers will need to maintain near-term support. Failure to do so would probably trigger a move to the $0.50 value area.
Information on these pages contains forward-looking statements that involve risks and uncertainties. Markets and instruments profiled on this page are for informational purposes only and should not in any way come across as a recommendation to buy or sell in these assets. You should do your own thorough research before making any investment decisions. FXStreet does not in any way guarantee that this information is free from mistakes, errors, or material misstatements. It also does not guarantee that this information is of a timely nature. Investing in Open Markets involves a great deal of risk, including the loss of all or a portion of your investment, as well as emotional distress. All risks, losses and costs associated with investing, including total loss of principal, are your responsibility. The views and opinions expressed in this article are those of the authors and do not necessarily reflect the official policy or position of FXStreet nor its advertisers.


