Top 3 Price Prediction Bitcoin, Ethereum, XRP: Crypto market forms multiple bear traps, bullish reversals incoming
|
- Bitcoin price continues to accumulate between $45,000 and $48,000.
- Ethereum price continues to display a rare bullish reversal buying opportunity before hitting the $6,000 value area.
- XRP price could gain more than 77% if it can regain the $1 value area.
Bitcoin price is seeing buying volume increase, establishing a solid support zone for the future. Ethereum price action is awaiting buyers to trigger one of the most potent and sought-after Point and Figure entry patterns. XRP price continues to tread water near its final support zones, but a bullish breakout could be imminent.
Bitcoin price action signals a bearish bias despite buyers in control
Bitcoin price action, from an Ichimoku perspective, is overwhelmingly bearish. The current close is below the Tenkan-Sen, the Kijun-Sen, and the Cloud (Senkou Span A and Senkou Span B). The highlighted red zone on the chart image below represents a make-or-break price level for Bitcoin since late November 2021.
The red zone establishes two levels within the current Volume Profile where Bitcoin is weakest. Below the $48,000 value area, Bitcoin is under massive threat of a fast collapse towards the next high volume node at $37,000. Bitcoin price has been flirting with a breakdown for over a month, however, and yet still, bears have been unable or unwilling to push Bitcoin into a sell-off zone.
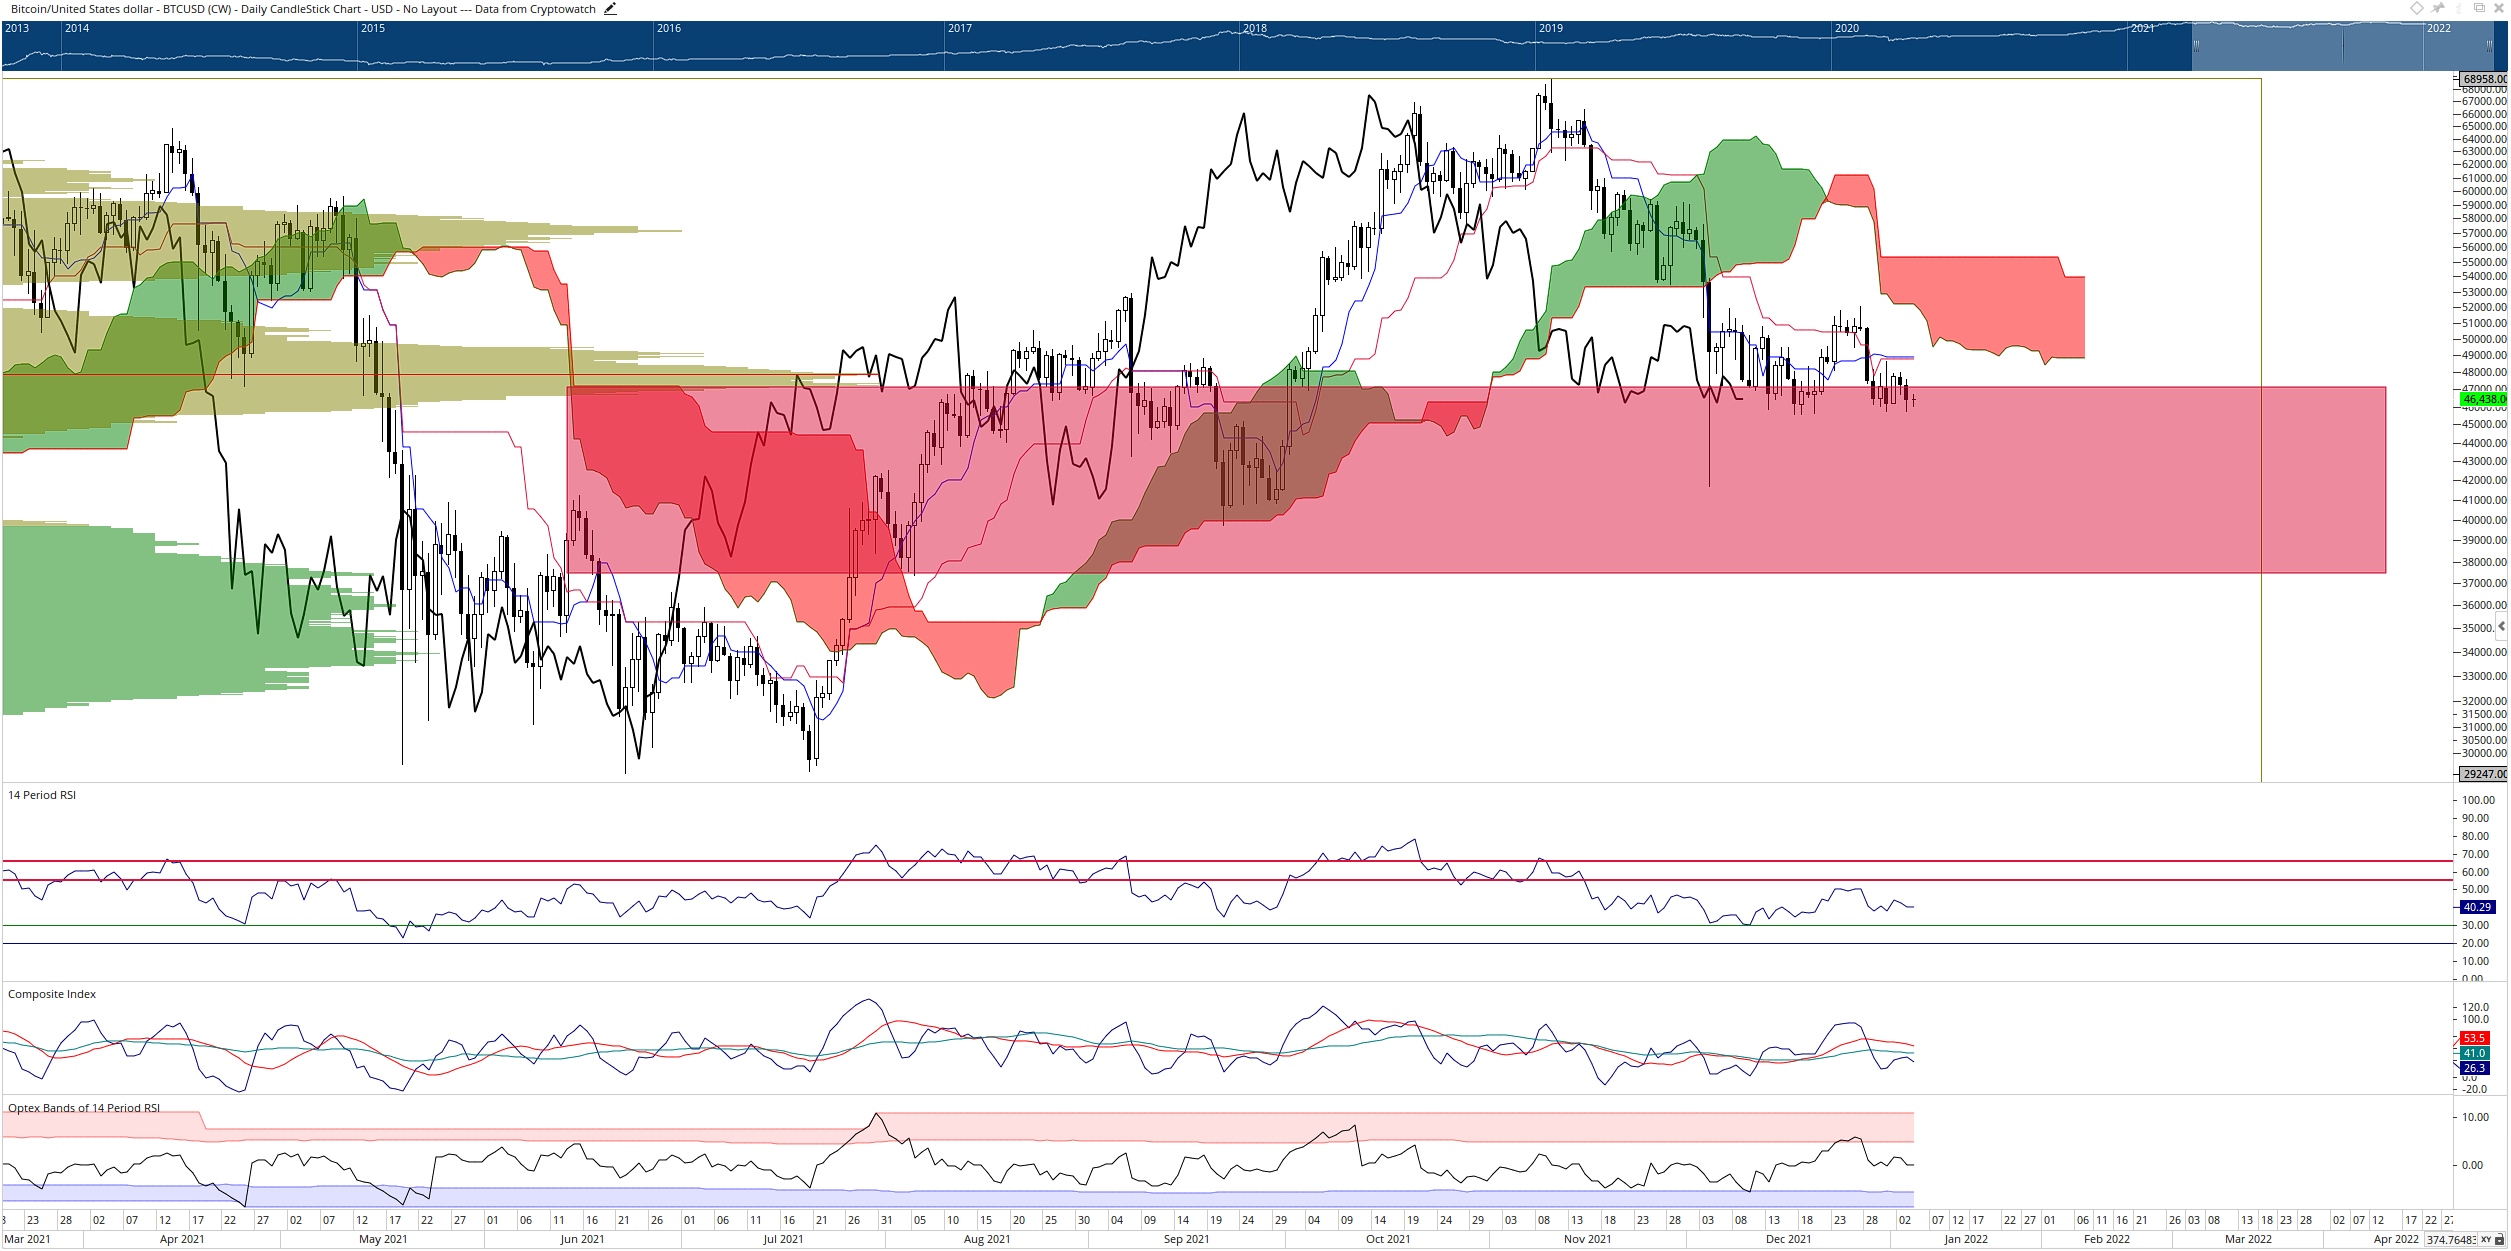
BTC/USD Daily Ichimoku Chart
The most likely explanation is that a bear trap is developing on the daily chart which could be confirmed if Bitcoin were to make a daily close above the Tenkan-Sen and Kijun-Sen at or above the $49,000 value area. In that scenario, a significant number of leveraged short positions would begin the liquidation process, likely rallying Bitcoin in the unregulated derivatives markets with some of that momentum spilling over into the spot market.

Ethereum price positioned for an explosive 50% drive higher
Ethereum price shows the development of a strong bullish reversal pattern in Point and Figure analysis known as the Bullish Shakeout. This pattern, however, t is only valid if an instrument is in a broader uptrend, and the entry must occur near the beginning of a bullish continuation move. In other words, the Bullish Shakeout allows traders to enter at one of the earliest opportunities after a corrective move.
The importance of this hypothetical buy setup is not just the pattern itself but the two other events that coincide if the entry is triggered. First, the entry would confirm a breakout above a triple-top. Second, the entry would convert Ethereum price action into a bull market on the $100/3-box reversal Point and Figure chart.
The hypothetical long entry for Ethereum price is a buy stop order at $4,000, a stop loss at $3,500, and a profit target at $6,000. This trade represents a 5:1 risk/reward ratio and 52% implied gain from the entry. A trailing stop of two to three boxes would help protect any potential profit after the entry is triggered.
ETH/USD $100/3-box Reversal Point and Figure Chart
This trade setup is invalidated if Ethereum price moves to $3,300. Ethereum would likely see a bearish setup to target the $2,800 value area in that scenario.

XRP price constricts against key Fibonacci and Ichimoku levels; breakout may occur soon
XRP price remains constrained inside a collection of critical Fibonacci and Ichimoku levels. Between the price range of $0.82 and $0.89, the Tenkan-Sen, Kijun-Sen, Senkou Span A, 38.2% Fibonacci retracement, and the 100% Fibonacci extension all exist. It is no wonder, therefore, that XRP has struggled to make any headway into the $0.90 price range.
Despite this, XRP could trigger a massive bullish explosion soon. The Optex Bands oscillator, Relative Strength Index, and Composite Index are all positioned perfectly to confirm any significant push higher by XRP price – and that such a move could be sustained. The key oscillator to watch is the Composite Index. If the Composite Index crosses above its moving averages, then XRP will probably be positioned near the $1.00 price level.
XRP/USD Daily Ichimoku Chart
Ultimately, XRP price needs a close at or above the $1.00 to ensure that XRP is in a clear and undeniable uptrend. Failure to hold the $0.80 support zone could trigger a massive drop towards the $0.50 zone.

Information on these pages contains forward-looking statements that involve risks and uncertainties. Markets and instruments profiled on this page are for informational purposes only and should not in any way come across as a recommendation to buy or sell in these assets. You should do your own thorough research before making any investment decisions. FXStreet does not in any way guarantee that this information is free from mistakes, errors, or material misstatements. It also does not guarantee that this information is of a timely nature. Investing in Open Markets involves a great deal of risk, including the loss of all or a portion of your investment, as well as emotional distress. All risks, losses and costs associated with investing, including total loss of principal, are your responsibility. The views and opinions expressed in this article are those of the authors and do not necessarily reflect the official policy or position of FXStreet nor its advertisers.