Top 3 Price Prediction Bitcoin, Ethereum, Ripple: BTC's resumption above $30,000 suggests further gains ahead
|
- Bitcoin price has restored above the $30,000 level and could test further if bullish momentum builds.
- Ethereum price has followed the BTC cue, recovering 50% of the ground lost on Monday.
- Ripple price continues to battle a multi-week roadblock, but bulls have taken lead with a 2.5% gain on the day.
Bitcoin price (BTC) is back within the desirable zone after breaking past a local resistance to kickstart what many hope to be a sustained uptrend. Following suit is the Ethereum price (ETH), which has managed to take back a significant part of the Monday losses, and now investors are looking to establish a new range high. In tandem with the general bullish sentiment, Ripple price (XRP) has once again identified a directional bias that could see the remittance token resume its rally north.
Bitcoin price back above $30,000, is a 10% climb sustainable?
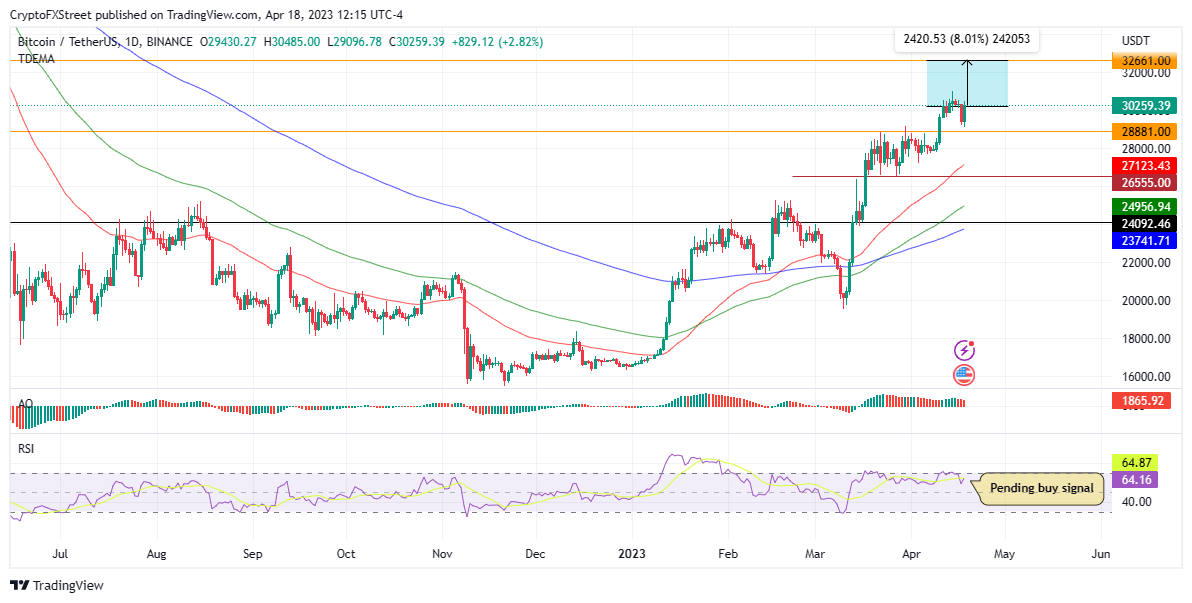
Bitcoin price has restored its position above the $30,000 level after a successful flip of the psychological $29,847 roadblock into support. At the time of writing, the flagship crypto is exchanging hands for $30,259.
An increase in buying pressure could facilitate a surge in Bitcoin price, with the most likely forecast being a flight to the $32,661 resistance level. Such a move would denote an upswing of around 10%. This thesis is supported by the upward direction of the Exponential Moving Averages (EMA) and the Relative Strength Index (RSI), indicating a new cohort of bulls entering the market. Notably, the 50-, 100-, and 200-day EMAs at $27,122, $24,956 and $23,741 represented entry positions for sidelined investors.
Given the position of the RSI at 64, there is still more room for Bitcoin price to rise. Further, if BTC maintains the current trajectory, the RSI could soon siren a buy signal after crossing the yellow line representing the Stochastic RSI. Traders heeding this call could solidify the uptrend for the king crypto, at least for the short term.
A 10% upswing would be sustainable if bullish momentum remains steadfast.
BTC/USDT 1-day chart
Conversely, if buying pressure reduces, presumably as day traders book profits, Bitcoin price could drop below the $30,000 cloud. In such a case, BTC could find support around $28,881 or, in the dire case, revisit the March 20 lows around $27,122.
Ethereum price subject to the dominance of Bitcoin
Ethereum price has reacted to Bitcoin dominance, taking a bullish turn that has seen ETH holders recoup most of the losses made on April 17. An increase in buyer momentum could enhance the uptrend for ETH, enabling a shatter of the immediate hurdle at $2,221 before a potential neck up to the $2,400 level in highly ambitious cases.
Ethereum price could benefit from additional momentum due to the recent Shanghai/Capella upgrade, with Messari researcher, Tom Dunleavy, reporting that there are approximately 6,000 validators on the Ethereum network patiently waiting to stake Ether on the protocol.
There are ~6k pending validators waiting to stake ETH pic.twitter.com/yUmX8au6L1
— Tom Dunleavy (@dunleavy89) April 18, 2023
There are ~6k pending validators waiting to stake ETH pic.twitter.com/yUmX8au6L1
— Tom Dunleavy (@dunleavy89) April 18, 2023
The support at $2,012 remains critical for the Ethereum price and marks the invalidation level for the current bullish thesis. Investors should watch this level as a break below it could open the drains for a downtrend.
ETH/USDT 1-day chart
On the flip side, bears could easily take charge if bullish momentum eases. Such an outcome could see the Ethereum price retrace the $2,012 support level. A daily candlestick close below this level could discredit the bullish postulation.
Ethereum price could fall back to the $1,835 support level, or worse, the early April lows around $1,753. Such a move would be troublesome for the PoS token.
Ripple price readies for a 10% upswing
Ripple price continues to battle the immediate hurdle of $0.52, which has stunted XRP since April 1. However, there is hope for the remittance token after bulls recovered the market, and now an upswing of about 10% could be underway. Moreover, the altcoin has recently taken to a symmetrical triangle pattern after it reversed from an intra-day high of $0.5264 in the April 18 trading session. The pattern forms when converging trendlines link a series of lower highs and higher lows, with the price consolidating between these trend lines.
The symmetric triangle pattern hints at a possible volatility spike soon, as XRP will likely break out of the governing chart pattern and display a more decisive trend. As it stands, this could be a brewing uptrend for Ripple price, setting the tone for a 7% upswing to $0.55.
Given that the triangle is narrowing, pressure is building up, and investors should expect a breakout soon. To support the upside, the direction of the 50-, 100-, and 200-day EMA at $0.46, $0.43, and $0.42, coupled with the upward-facing RSI, hinted that the path with the least resistance was northward.
XRP/USDT 1-day chart
On the other hand, if XRP makes a decisive move southward, the Ripple price could extend toward the $0.48 support level.
Also Read: This is why pro-XRP lawyer believes the SEC will lose the Ripple lawsuit
Information on these pages contains forward-looking statements that involve risks and uncertainties. Markets and instruments profiled on this page are for informational purposes only and should not in any way come across as a recommendation to buy or sell in these assets. You should do your own thorough research before making any investment decisions. FXStreet does not in any way guarantee that this information is free from mistakes, errors, or material misstatements. It also does not guarantee that this information is of a timely nature. Investing in Open Markets involves a great deal of risk, including the loss of all or a portion of your investment, as well as emotional distress. All risks, losses and costs associated with investing, including total loss of principal, are your responsibility. The views and opinions expressed in this article are those of the authors and do not necessarily reflect the official policy or position of FXStreet nor its advertisers.
