Top 3 Price Prediction Bitcoin, Ethereum, Ripple: BTC targets $70,000 as bullish momentum builds
|
- Bitcoin is retesting the $66,000 resistance level; a firm close above it could continue its ongoing rally.
- Ethereum price broke above its resistance barrier, eyeing for a rally ahead.
- Ripple price is approaching the 200-day EMA at $0.553; a close above suggests a possible recovery.
Bitcoin (BTC) is currently retesting its key resistance level, and a solid close above this threshold could fuel its ongoing rally. Meanwhile, Ethereum has successfully breached its resistance, signaling potential upward momentum, while Ripple approaches its crucial resistance barrier, where a close above may indicate a forthcoming recovery.
Bitcoin bulls aim for $70,000 mark
Bitcoin price found support around its 200-day Exponential Moving Average (EMA) at $60,217 on Thursday and rallied 9.7% to restest its $66,000 psychological level in the next four days. As of Tuesday, it trades slightly down to around $65,700.
If BTC breaks and closes above the $66,000 level, it could continue its ongoing rally to retest its July 29 high of $70,079.
The Moving Average Convergence Divergence (MACD) indicator further supports Bitcoin’s rise, signaling a bullish crossover on the daily chart. The MACD line (blue line) moved above the signal line (yellow line), giving a buy signal on Monday. It shows rising green histogram bars above the neutral line zero, also suggesting that Bitcoin’s price could experience upward momentum.
Furthermore, the Relative Strength Index (RSI) on the daily chart shows that Bitcoin is not yet overbought, as it trades at 62 but is close to the overbought level of 70. If it enters the zone on a closing basis, traders will be advised not to add to their long positions, although the rally may continue. If it enters overbought and then exits back into the neutral level of 50, it will be a sign of a deeper correction.
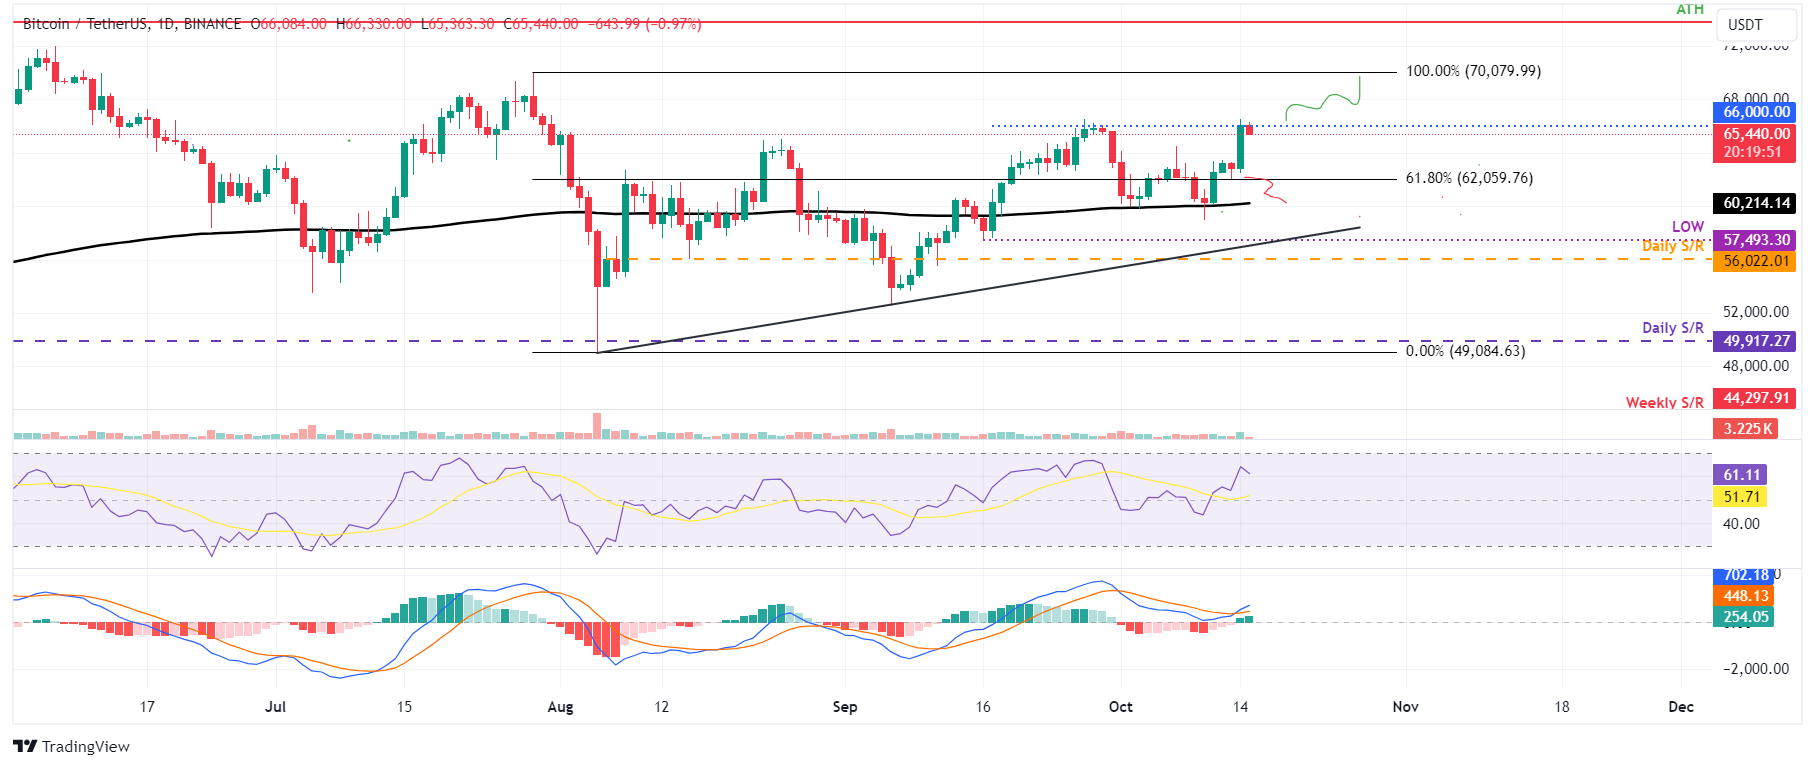
BTC/USDT daily chart
However, if Bitcoin fails to find support at around $62,000 and closes below it, it could extend the decline by 3% to retest its 200-day EMA at around $60,000.
Ethereum bulls show signs of retaliation
Ethereum price broke above the daily resistance level at $2,461 and rallied 6.5%, closing above its 50-day EMA at $2,536 on Monday. At the time of writing on Tuesday, it trades slightly down around $2,600.
If the 50-day EMA at $2,536 holds as support, ETH could extend the rally to retest its August 24 high of $2,820.
The MACD indicator further supports Ethereum’s rise, signaling a bullish crossover on the daily chart. The MACD line moved above the signal line, giving a buy signal on Monday. It shows rising green histogram bars above the neutral line zero, also suggesting that Ethereum’s price could experience upward momentum.
Additionally, the RSI on the daily chart trades at 59, above its neutral level of 50, suggesting bullish momentum and a further rise in Ethereum.
ETH/USDT daily chart
On the other hand, if Ethereum's price closes below the daily support level at $2,461, it could extend the decline by 13% to retest its September 6 low of $2,155.
Ripple price could rally if it closes above 200-day EMA
Ripple price broke above the daily resistance level at $0.544 on Monday. As of Tuesday, it trades at around $0.547, nearing its 200-day EMA at $0.553.
If XRP breaks and closes above the 200-day EMA at $0.553, it could rally over 13% to retest its next daily resistance at $0.626.
The MACD indicator is about to flip a bullish crossover on the daily chart. If the MACD line moved above the signal line, it would give a buy signal. This suggests that bullish momentum is in control and could experience upward momentum.
XRP/USDT daily chart
However, if the XRP price fails to close above the $0.553 level and closes below the daily resistance level at $0.547. This scenario could lead to a decline in the Ripple price to retest the October 3 low of $0.506.
Bitcoin, altcoins, stablecoins FAQs
Bitcoin is the largest cryptocurrency by market capitalization, a virtual currency designed to serve as money. This form of payment cannot be controlled by any one person, group, or entity, which eliminates the need for third-party participation during financial transactions.
Altcoins are any cryptocurrency apart from Bitcoin, but some also regard Ethereum as a non-altcoin because it is from these two cryptocurrencies that forking happens. If this is true, then Litecoin is the first altcoin, forked from the Bitcoin protocol and, therefore, an “improved” version of it.
Stablecoins are cryptocurrencies designed to have a stable price, with their value backed by a reserve of the asset it represents. To achieve this, the value of any one stablecoin is pegged to a commodity or financial instrument, such as the US Dollar (USD), with its supply regulated by an algorithm or demand. The main goal of stablecoins is to provide an on/off-ramp for investors willing to trade and invest in cryptocurrencies. Stablecoins also allow investors to store value since cryptocurrencies, in general, are subject to volatility.
Bitcoin dominance is the ratio of Bitcoin's market capitalization to the total market capitalization of all cryptocurrencies combined. It provides a clear picture of Bitcoin’s interest among investors. A high BTC dominance typically happens before and during a bull run, in which investors resort to investing in relatively stable and high market capitalization cryptocurrency like Bitcoin. A drop in BTC dominance usually means that investors are moving their capital and/or profits to altcoins in a quest for higher returns, which usually triggers an explosion of altcoin rallies.
Information on these pages contains forward-looking statements that involve risks and uncertainties. Markets and instruments profiled on this page are for informational purposes only and should not in any way come across as a recommendation to buy or sell in these assets. You should do your own thorough research before making any investment decisions. FXStreet does not in any way guarantee that this information is free from mistakes, errors, or material misstatements. It also does not guarantee that this information is of a timely nature. Investing in Open Markets involves a great deal of risk, including the loss of all or a portion of your investment, as well as emotional distress. All risks, losses and costs associated with investing, including total loss of principal, are your responsibility. The views and opinions expressed in this article are those of the authors and do not necessarily reflect the official policy or position of FXStreet nor its advertisers.