Top 3 Price Prediction Bitcoin, Ethereum, Ripple: BTC shows potential for a recovery rally
|
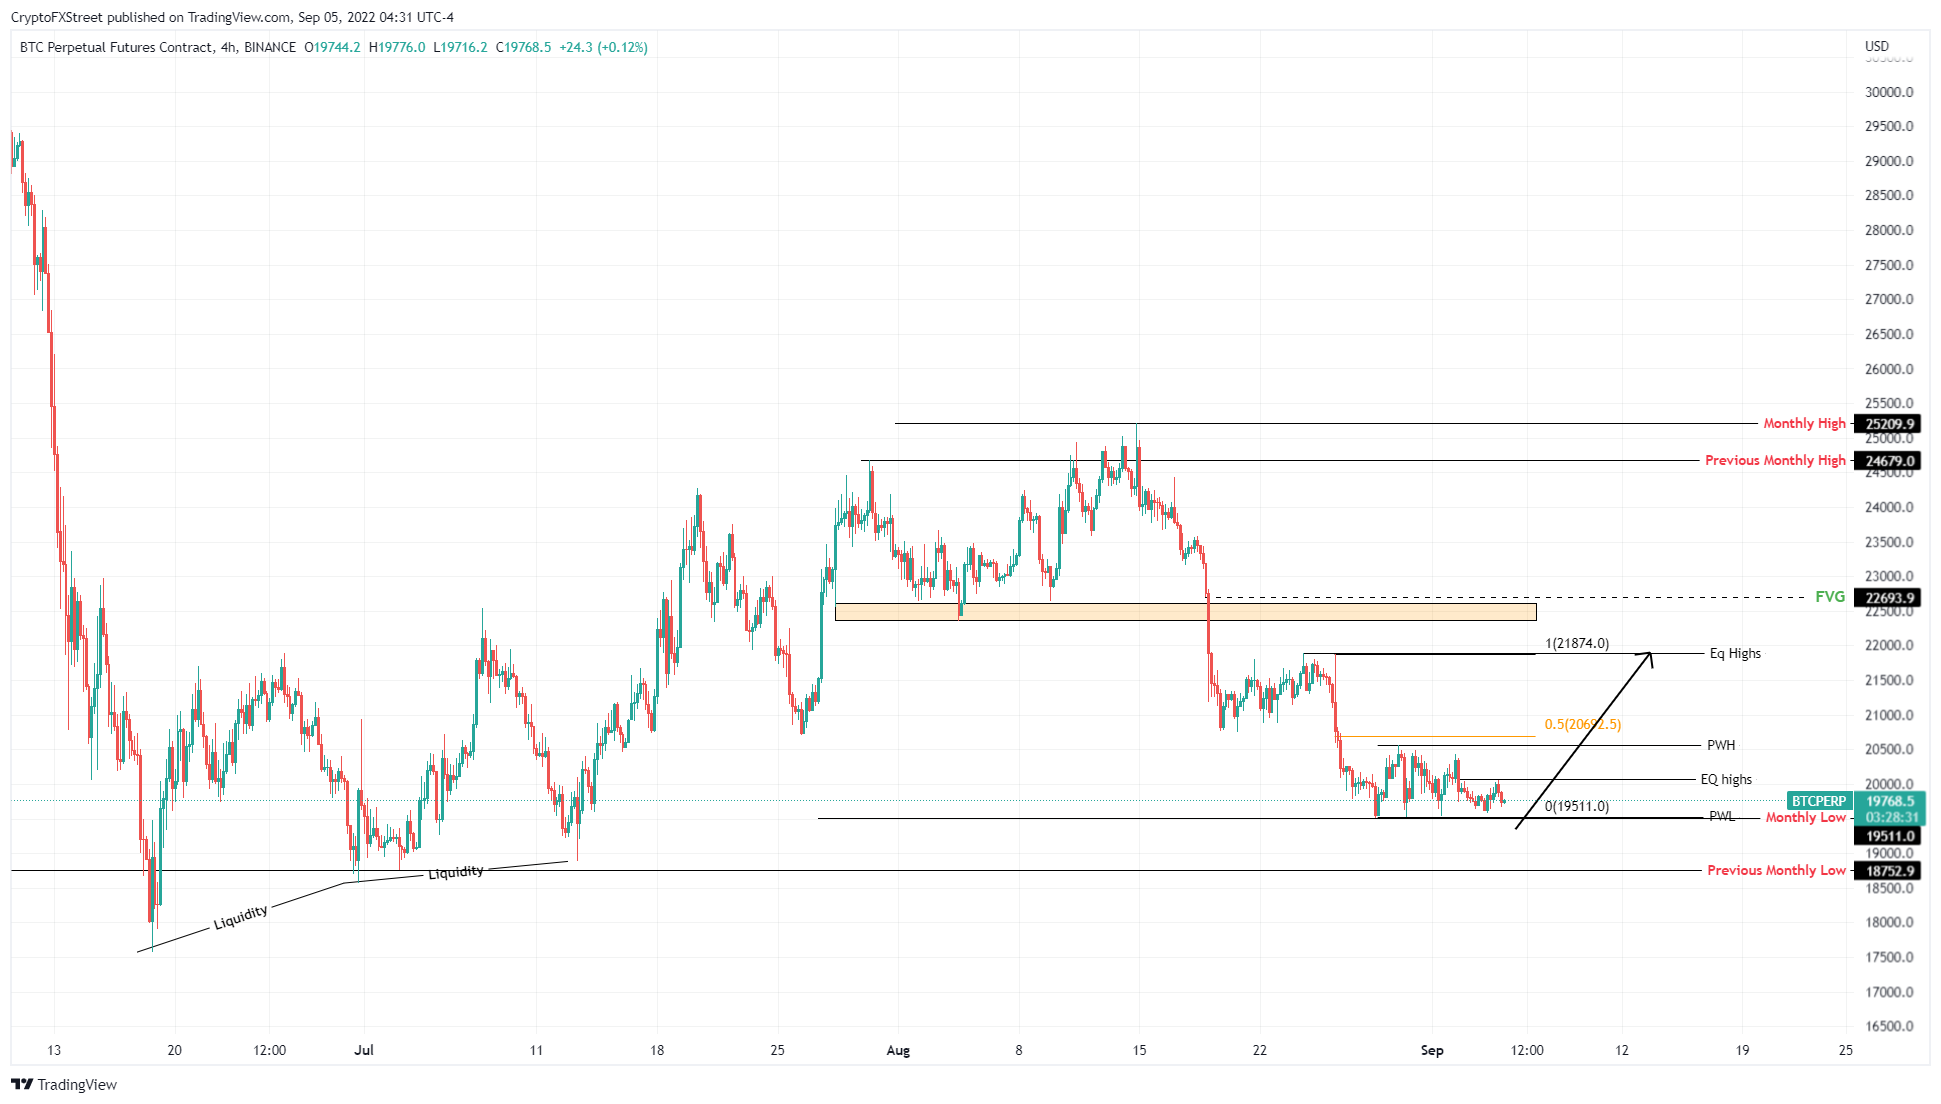
- Bitcoin price continues to struggle, but a sweep of $19,511 followed by a quick recovery could trigger a recovery rally to $20,692 and $21,874.
- Ethereum price follows Bitcoin’s footsteps and might drop to $1,471 to fill the imbalance.
- Ripple price shows an ascending triangle formation forecasting a 25% breakout from a long-term perspective.
Bitcoin price reveals a bearish start to the week, which would allow market makers to collect the much-anticipated sell-stop liquidity. This development is extremely important as it may set the base for an upcoming BTC and altcoin-wide recovery rally.
Bitcoin price hints at volatility
Bitcoin price has created equal lows at $19,511, which also coincides with the August low, making it an extremely important level to watch out for. A sweep of the aforementioned barrier could provide the buy signal for a recovery rally, which will be mainly driven by a reversion to the mean price after a 10% crash.
In such a case, investors can expect Bitcoin price to rally to $20,692, which is the midpoint of the $21,874 to $19,511 range. However, clearing this hurdle will lead to a sweep of the $21,874 level.
BTC/USD 4-hour chart
While things look promising for Bitcoin price, a daily candlestick close below $19,511 could result in the invalidation of the recovery rally. This development will also invalidate the bullish thesis and could further crash to $18,752.
Ethereum price shells out bearish signals
Ethereum price follows Bitcoin price and is attempting to break below the 50% Fibonacci retracement level at $1,563. If successful, it will confirm a bearish breakout and trigger a minor down move to $1,531.
Depending on the selling pressure, Ethereum price could visit $1,505 and fill the imbalance, extending from $1,471 to $1,454.
ETH/USD 4-hour chart
On the other hand, if Ethereum price flips range high at $1,706 into a support floor, it will invalidate the bearish thesis. This development could see ETH revisit $1,730 and, in some cases, $1,800.
Ripple price ready to make a big-time move
Ripple price has produced three distinctive higher lows and five equal highs at $0.381 since June 13. Connecting trend lines to these swing points reveals an ascending triangle. This technical formation forecasts a 25% upswing, determined by adding the distance between the first swing high at swing low to the breakout point at $0.381.
However, Ripple price and its journey north will face a hurdle at $0.439, clearing this level will put the $0.477 target in reach.
XRP/USD 1-day chart
Regardless of the bullish outlook, investors should prepare for a sweep of August 29 lows at $0.318. However, a flip of this level, creating a lower low without a recovery will invalidate the bullish thesis for Ripple price.
Information on these pages contains forward-looking statements that involve risks and uncertainties. Markets and instruments profiled on this page are for informational purposes only and should not in any way come across as a recommendation to buy or sell in these assets. You should do your own thorough research before making any investment decisions. FXStreet does not in any way guarantee that this information is free from mistakes, errors, or material misstatements. It also does not guarantee that this information is of a timely nature. Investing in Open Markets involves a great deal of risk, including the loss of all or a portion of your investment, as well as emotional distress. All risks, losses and costs associated with investing, including total loss of principal, are your responsibility. The views and opinions expressed in this article are those of the authors and do not necessarily reflect the official policy or position of FXStreet nor its advertisers.


