Top 3 Price Prediction Bitcoin, Ethereum, Ripple: BTC hangs on last line of defense after dragging market down
|
- Bitcoin price continued its crash as it slid another 11% today, pushing below $40,000.
- Ethereum price promptly followed the flagship cryptocurrency as it dropped below $3,000.
- Ripple is also deep inside the immediate demand zone, extending from $1.340 to $1.477, after Wednesday’s downswing.
Bitcoin price dragged the entire market down with it as it slid below critical levels. A similar turn of events occurred with Ethereum price as it fell under a key psychological level. Ripple price continues to be stuck between a wide support area and a resistance level.
Bitcoin price and its recent collapse
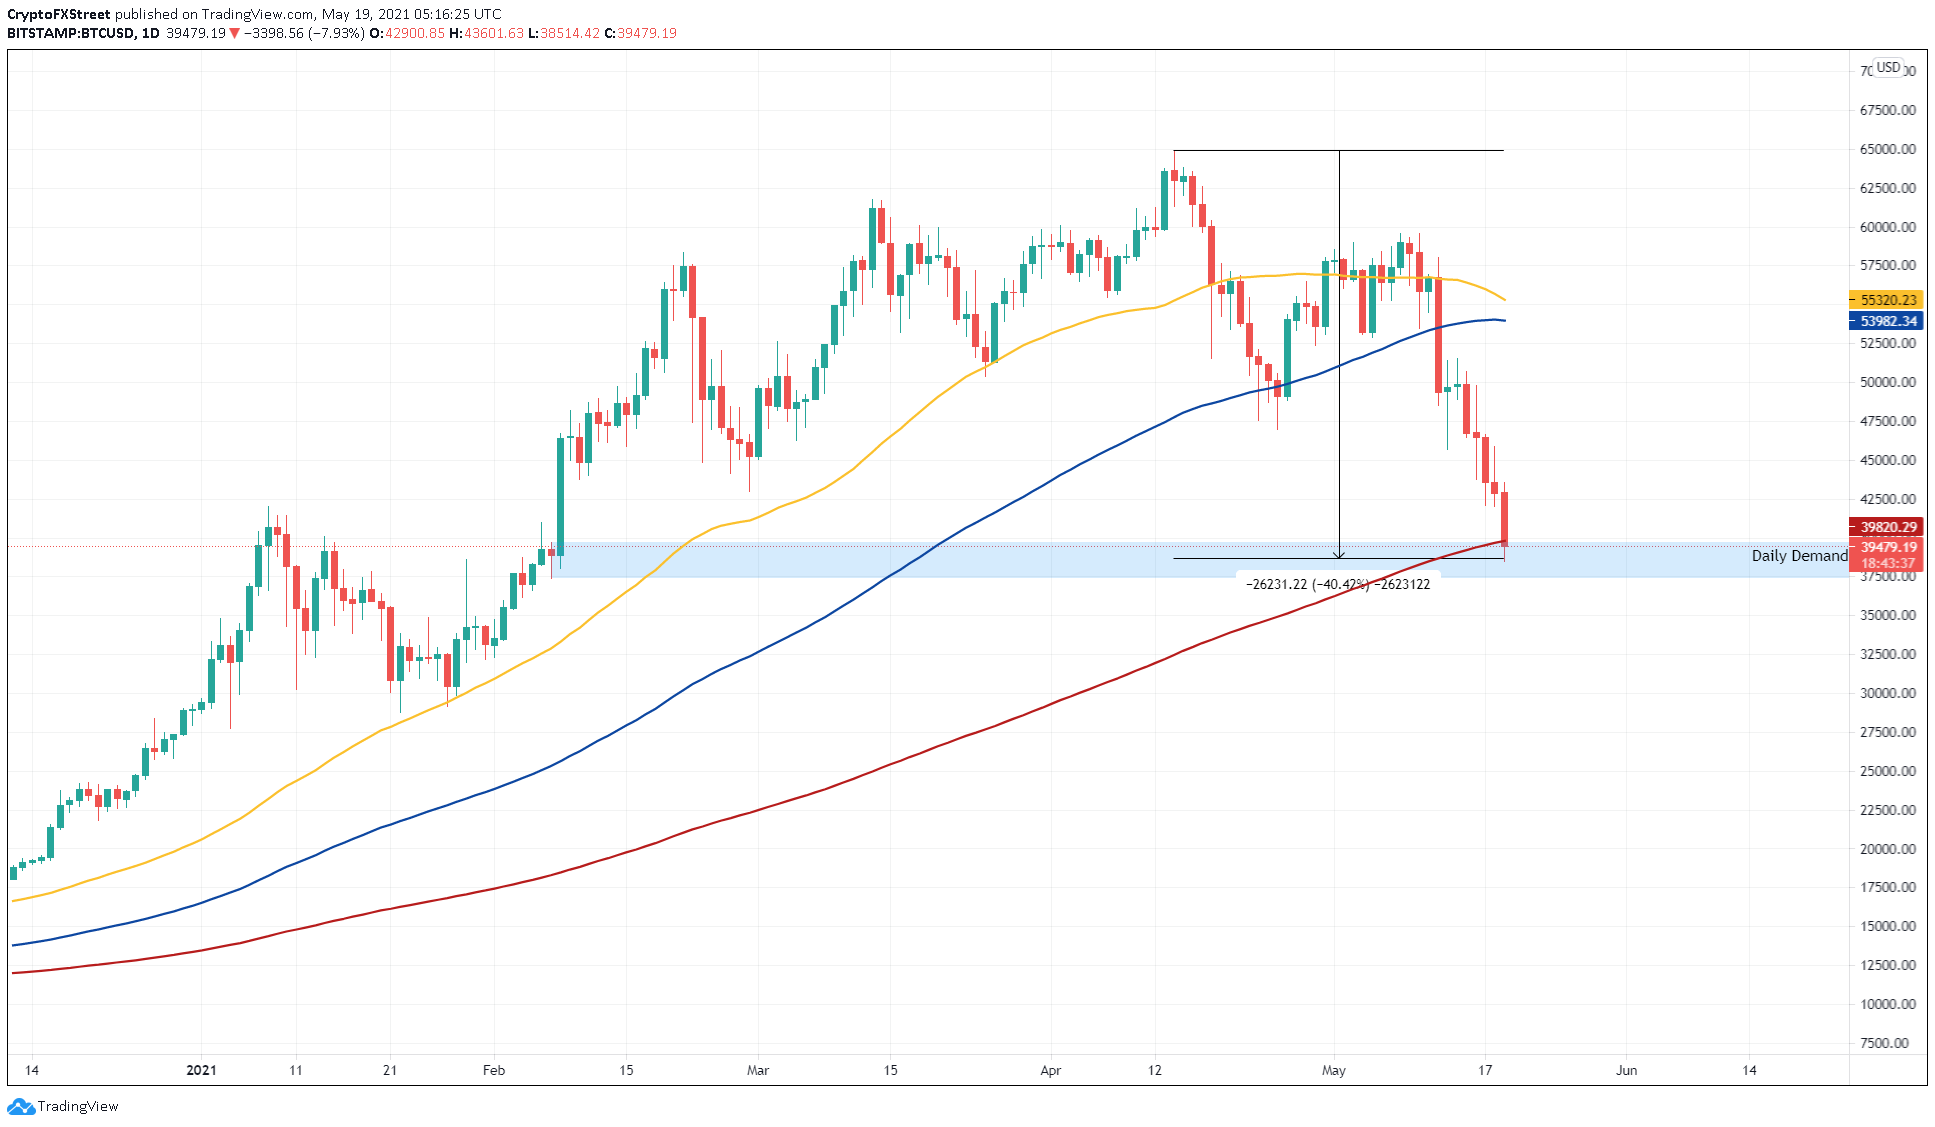
Bitcoin price is fragile as it trades around the 200-day Simple Moving Average (SMA) at $39,820. A decisive daily candlestick close below this would be highly bearish. Typically, a move above this level would indicate a macro shift in trend to bullish.
The opposite of this would also hold, which is why investors need to keep a close eye on the next daily close.
If the Bitcoin price closes above $39,820, BTC could surge 25% to $51,420, the recent swing high. Following a breach of the level mentioned above, the flagship cryptocurrency might tag the 50-day and 100-day SMAs at $55,320 and $53,982, respectively.
On the flip side, a convincing close below the 200-day SMA at $39,820, followed by a breakdown of $37,412 will invalidate the bullish outlook. Under these circumstances, Bitcoin price might slide 8% to $34,245, the next support barrier.
Ethereum price stumbles but looks bullish
Ethereum price followed in the footsteps of the flagship cryptocurrency as it dropped roughly 17% on the day. However, ETH failed to tag the 50-day SMA at $2,765. Going forward, even if there is short-term selling pressure, Ethereum will most likely tackle it and make a comeback at the level mentioned above.
A surge in buying pressure here could catapult the smart contract token by 24% to the first resistance barrier at $3,430. Following this, if the bid orders continue to increase, investors could see the altcoin pioneer rise another 13% to test the swing high at $3,881 set up on May 16.
ETH/USD 1-day chart
With disregard to the support levels, if the market continues to freefall, it is inevitable that ETH price will shatter the 50-day SMA at $2,765 and test the subsequent level at $2,247. Interestingly, the 100-day SMA is present inside the demand zone that extends from $2,106 to $2,397.
While a sell-off into this level would be bearish without a doubt, a breakdown below $2,106 will completely invalidate the optimistic narrative detailed above. Such a move would invoke a 27% crash to the 200-day SMA at $1,544 in the process.
Ripple price ranges despite recent flash crash
Ripple price shows resilience as it depreciated 17% during Wednesday’s volatile trading session. At the time of writing, XRP trades around $1.455, inside the demand zone that stretches from $1.340 to $1.477.
Although the flash crash took a toll on most altcoins, Ripple price remained within the range mentioned above. Now a surge in buying pressure will most likely push the remittance token up by 13% to a critical supply barrier at $1.653.
If buyers manage to produce a decisive 4-hour candlestick close above this level, XRP price will signal the start of a new uptrend. In that case, Ripple might rise 7% to its first area of interest at $1.769. Following a successful breach of this, XRP price will tag $2.
XRP/USDT 4-hour chart
A breakdown of the 50% Fibonacci retracement level at $1.312 will invalidate the bullish thesis. If the ask orders continue to pile up, XRP price could slide 8.5% to $1.20.
Information on these pages contains forward-looking statements that involve risks and uncertainties. Markets and instruments profiled on this page are for informational purposes only and should not in any way come across as a recommendation to buy or sell in these assets. You should do your own thorough research before making any investment decisions. FXStreet does not in any way guarantee that this information is free from mistakes, errors, or material misstatements. It also does not guarantee that this information is of a timely nature. Investing in Open Markets involves a great deal of risk, including the loss of all or a portion of your investment, as well as emotional distress. All risks, losses and costs associated with investing, including total loss of principal, are your responsibility. The views and opinions expressed in this article are those of the authors and do not necessarily reflect the official policy or position of FXStreet nor its advertisers.
