Top 3 Price Prediction Bitcoin, Ethereum, Ripple: BTC, ETH reach record highs, XRP begins catch-up
|
- Bitcoin price hit a new all-time high at $63,287 ahead of Coinbase IPO.
- Ethereum price also formed a new all-time high of $2,229 and remains extremely bullish.
- XRP price is up by 170% in the past two weeks as it seems Ripple will win the SEC lawsuit.
The cryptocurrency market has finally hit a $2 trillion market capitalization for the first time ever as most of the top coins established new all-time highs. The much-hyped Coinbase IPO (Initial Public Offering) will be live on Wednesday, April 14, and it already seems to have helped the industry.
Bitcoin price aims for $74,000 in the long term
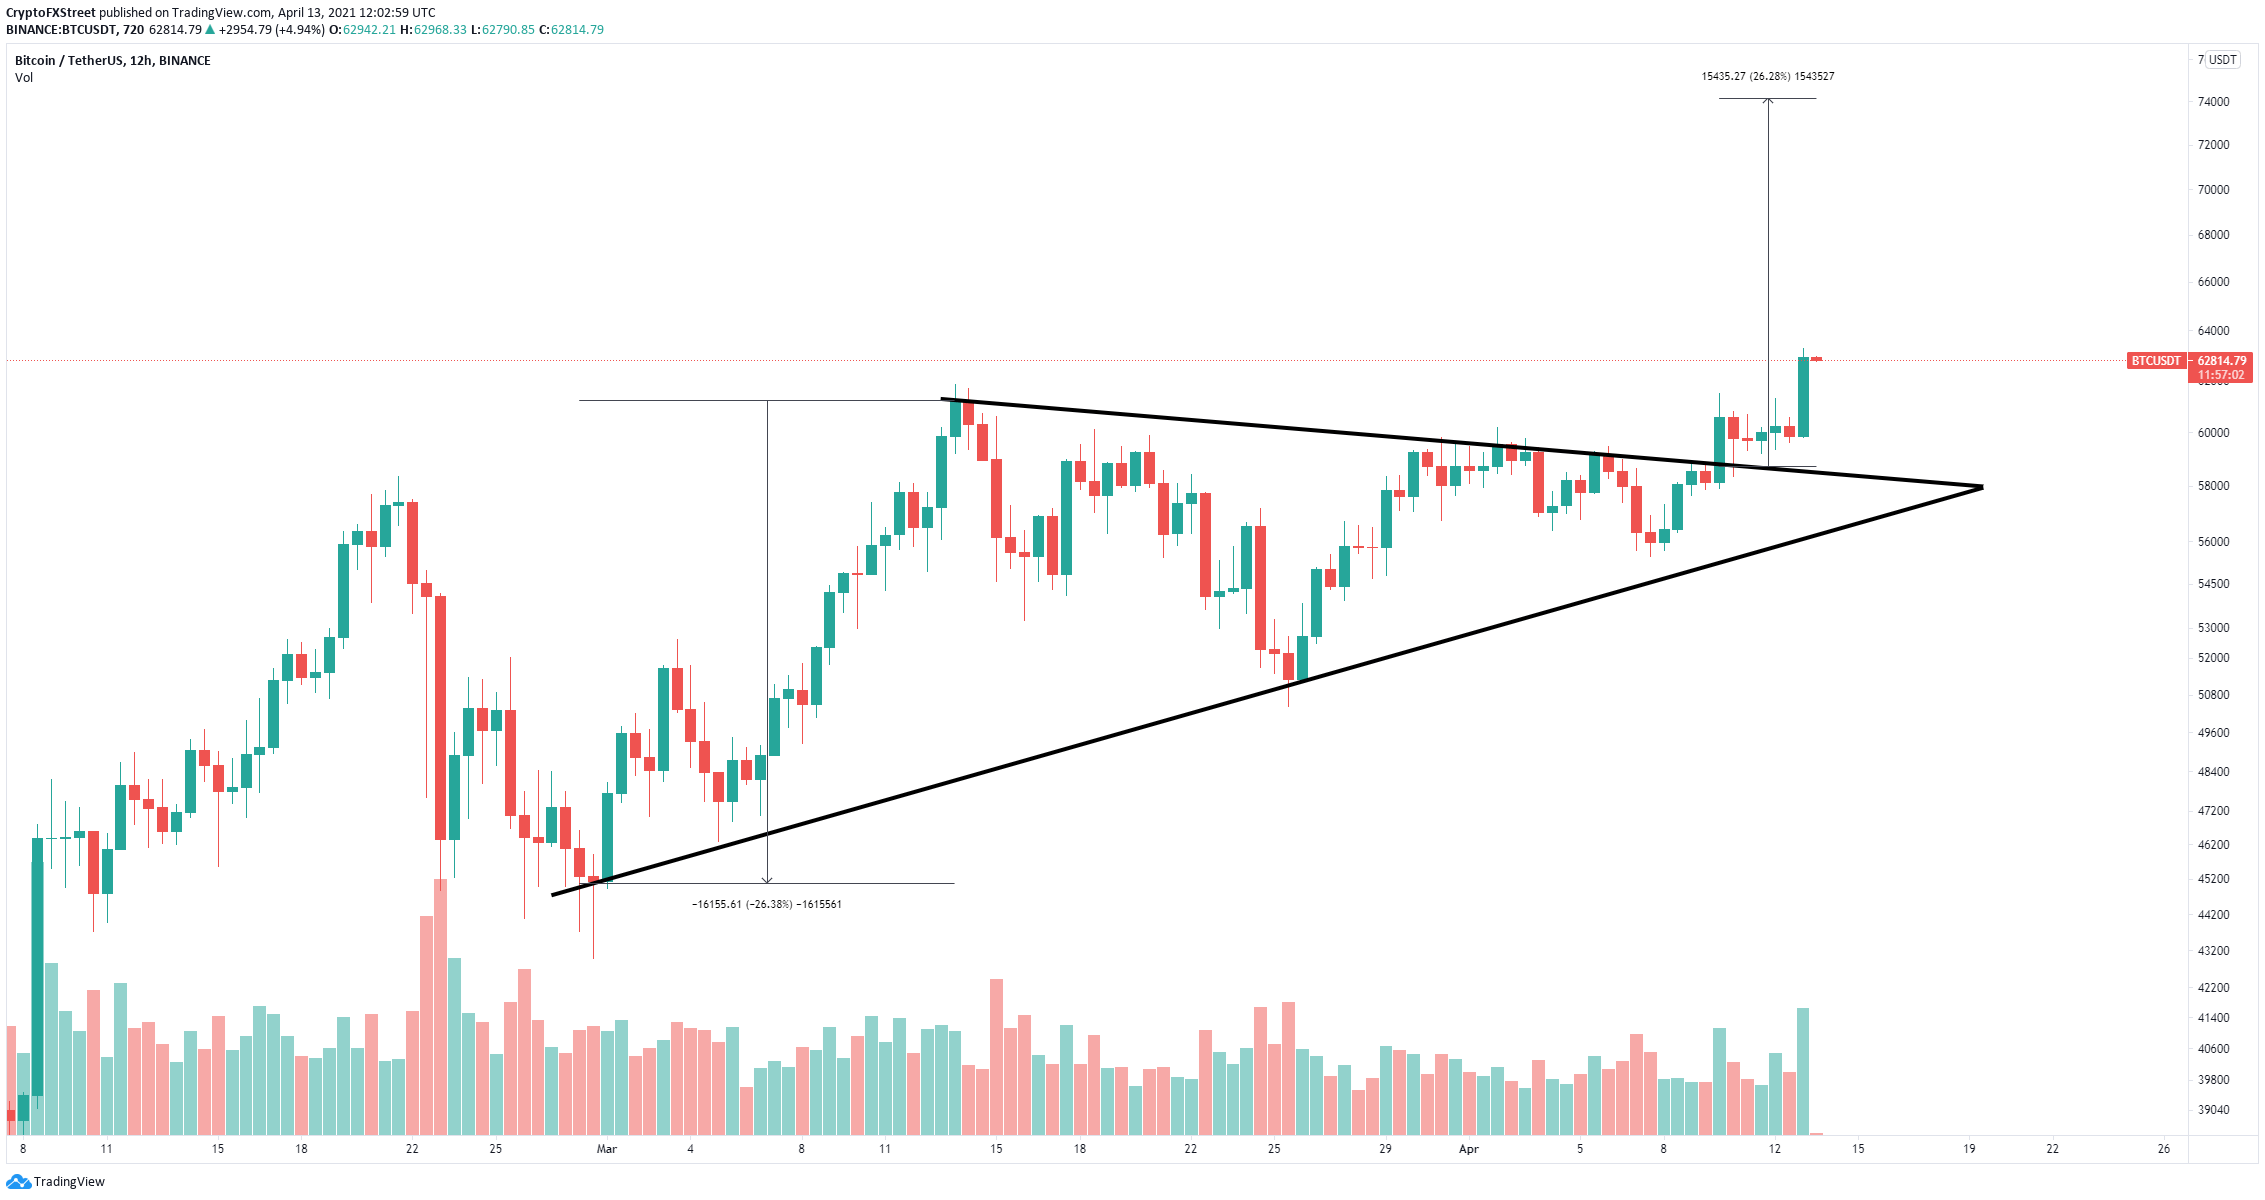
On the 12-hour chart, Bitcoin broke out of a symmetrical triangle pattern that can be drawn by connecting the lower highs and higher lows with two trend lines that converge. Measuring the distance between the beginning of the top trend line and the lower one, we get 26%.
BTC/USD 12-hour chart
This 26% move has a price target of $74,000 in the long term, although Bitcoin will most likely pause at $65,000 and $70,000 as they are psychological levels. The flagship cryptocurrency faces no real resistance ahead as these are new all-time highs.
One of the largest events in the cryptocurrency industry, the Coinbase IPO will go live on Wednesday, April 14. If it does well, the entire crypto market should also profit from it, some analysts have even called it the most important IPO of the year.
Ethereum price breaks out of crucial pattern
On the 4-hour chart, Ethereum has broken out of a cup-and-handle pattern in the past 12 hours. We discussed this possibility in our last ETH analysis here. The initial price target of this breakout is $2,400.
ETH/USD 4-hour chart
Ethereum is facing no resistance ahead, which means a jump to $2,400 is imminent. More than $61.5 billion worth of ETH is currently locked away, representing about 1/5 of its entire market capitalization.
ETH/USD 12-hour chart
On the 12-hour chart, Ethereum has broken out of an ascending wedge pattern that has a price target of $2,850, calculated by measuring the distance between the beginning of the top trend line and the lower one.
XRP price continues to explode to new highs in unstoppable rally
XRP price is up by 170% in the past two week and seems to face no resistance ahead. The digital asset has already surpassed the 161.8% Fibonacci level and aims to hit the next level at $1.86, which is the 178.6% Fibo point.
XRP/USD 12-hour chart
Surprisingly, the trading volume remains high, and it is increasing again in the past 24 hours, which indicates that the current leg up has a lot of strength.
XRP volume chart
A breakout above $1.86 would drive XRP price toward $2.06 at the 200% Fibonacci level, but it is worth noting that Ripple might continue climbing higher as it is the only digital asset in the top five that has not reached a new all-time high. The previous one was established in January 2018 at $3.67.
Information on these pages contains forward-looking statements that involve risks and uncertainties. Markets and instruments profiled on this page are for informational purposes only and should not in any way come across as a recommendation to buy or sell in these assets. You should do your own thorough research before making any investment decisions. FXStreet does not in any way guarantee that this information is free from mistakes, errors, or material misstatements. It also does not guarantee that this information is of a timely nature. Investing in Open Markets involves a great deal of risk, including the loss of all or a portion of your investment, as well as emotional distress. All risks, losses and costs associated with investing, including total loss of principal, are your responsibility. The views and opinions expressed in this article are those of the authors and do not necessarily reflect the official policy or position of FXStreet nor its advertisers.
