Top 3 Price Prediction Bitcoin, Ethereum, Ripple: Bitcoin finds rejection around the $70,000 level
|
-
Bitcoin price faces rejection around the weekly level of $69,648, a close above it would indicate a bullish move.
-
Ethereum price finds support around the daily level of $3,076, signaling a potential bullish trend on the horizon.
-
Ripple price finds support around the daily support level at $0.544, with an impending rally eyed.
Bitcoin (BTC) price struggles to break through the $70,000 threshold, while Ethereum (ETH) and Ripple (XRP) are maintaining stability at their daily support levels, suggesting a potential rally could be on the horizon.
Bitcoin price shows potential for a rally following a close above $70,000 level
Bitcoin price retested the daily support at $64,737 on July 25 and rallied 4% the next three days. Currently, it faces rejection at the weekly resistance level of $69,648. As of Tuesday, it trades slightly down 0.67% at $66,406.
If the daily support at $66,406 and the ascending trendline holds, BTC could rise 10% to retest its June 7 high of $71,997.
On the daily chart, the Relative Strength Index (RSI) and the Awesome Oscillator (AO) indicators are trading above their neutral levels of 50 and zero, respectively. This robust momentum signals a strong bullish sentiment in the market.
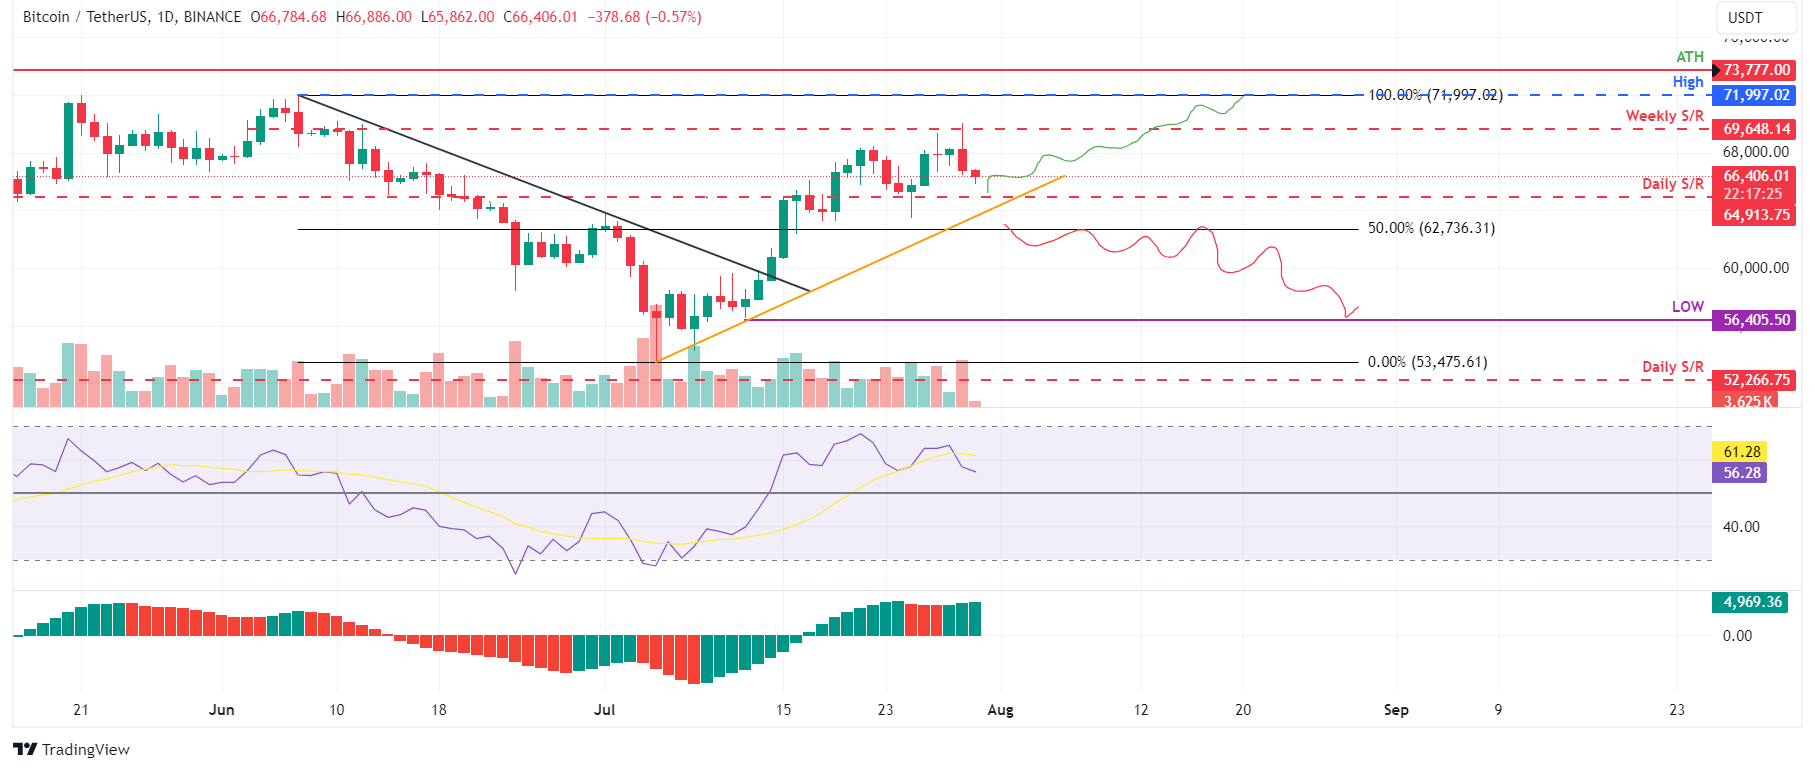
BTC/USDT daily chart
However, a close below $62,736 and a break below the ascending trendline would change the market structure from bullish to bearish by forming a lower low on the daily timeframe. Such a scenario might precipitate a 10% crash in Bitcoin's price to retest its July 12 low of $56,405.
Ethereum price poised for a rally after retesting the trendline support area
Ethereum price retested the daily support level around $3,076 on July 25 and bounced 4.63% over the next four days. This daily support level also coincides with the former trendline resistance and is now acting as support. As of Tuesday, ETH trades slightly lower by 0.43% at $3,302.
If this level at $3,076 holds, ETH could rally 15% to retest its 61.8% Fibonacci retracement level at $3,530.
The Relative Strength Index (RSI) and the Awesome Oscillator (AO) on the daily chart have briefly slipped below their neutral levels of 50 and zero, respectively. If bulls are indeed making a comeback, then both momentum indicators must maintain their positions above their respective levels. Such a development would add a tailwind to the recovery rally.
If bullish sentiment prevails and the overall cryptocurrency market outlook remains optimistic, Ethereum price could close above the $3,530 mark, potentially continuing its rally by 5.3% to challenge its June 9 daily peak of $3,721.
ETH/USDT daily chart
On the other hand, if Ethereum's daily candlestick closes below $2,817, forming a lower low in the daily timeframe, it may signal persistent bearish sentiment. This scenario could trigger a 7% decline in Ethereum's price, targeting a revisit of its daily support at $2,621.
Ripple price eyes a rally following a close above the $0.643 mark
Ripple price retested its daily support at $0.544 and rallied 5% earlier this week. As of Tuesday, it trades slightly lower, 0.7%, reaching $0.597.
If XRP closes above the $0.643 level, it could rally 13.3% to retest its next daily resistance level at $0.724.
On the daily chart, the Relative Strength Index (RSI) and the Awesome Oscillator (AO) are currently above their neutral levels of 50 and zero, respectively. These momentum indicators strongly indicate bullish dominance.
XRP/USDT daily chart
However, if Ripple's daily candlestick closes below the $0.510 level, it indicates sustained bearish sentiment, forming a lower low in the daily timeframe. Such a scenario could lead to an 18% crash in Ripple's price, targeting a revisit of its weekly support at $0.413.Related news.
Information on these pages contains forward-looking statements that involve risks and uncertainties. Markets and instruments profiled on this page are for informational purposes only and should not in any way come across as a recommendation to buy or sell in these assets. You should do your own thorough research before making any investment decisions. FXStreet does not in any way guarantee that this information is free from mistakes, errors, or material misstatements. It also does not guarantee that this information is of a timely nature. Investing in Open Markets involves a great deal of risk, including the loss of all or a portion of your investment, as well as emotional distress. All risks, losses and costs associated with investing, including total loss of principal, are your responsibility. The views and opinions expressed in this article are those of the authors and do not necessarily reflect the official policy or position of FXStreet nor its advertisers.