Top 3 Price Prediction Bitcoin, Ethereum, Ripple: Bitcoin breaks above the descending trendline
|
- Bitcoin price breaks above the descending trendline on Sunday, signaling a potential bullish momentum in the near future.
- Ethereum's price surges above the $3,240 level, marking a shift in market structure from bearish to bullish.
- Ripple's price breaches the daily resistance level at 0.499 on Saturday, signaling a potential bullish trend on the horizon.
Bitcoin (BTC) broke above its descending trendline on Sunday, signaling potential bullish momentum in the near term. Concurrently, Ethereum (ETH) and Ripple (XRP) also surged, surpassing significant resistance levels and setting the stage for a bullish trajectory across the cryptocurrency market.
Bitcoin price sets for a rally
Bitcoin price broke above the descending trendline on Sunday, trading 1% up at $61,365 on Monday. The trendline is formed by connecting multiple swing high levels from early June to mid-July.
If the trendline holds as pullback support around the $58,357 level, which coincides with the weekly support level, BTC could rally 9% from that level, targeting its daily resistance level of $63,956.
The Relative Strength Index (RSI) on the daily chart is trading above the neutral level of 50, and the Awesome Oscillator (AO) is on its way to doing the same. If bulls are indeed making a comeback, then both momentum indicators must maintain their positions above their respective mean levels. Such a development would add a tailwind to the recovery rally.
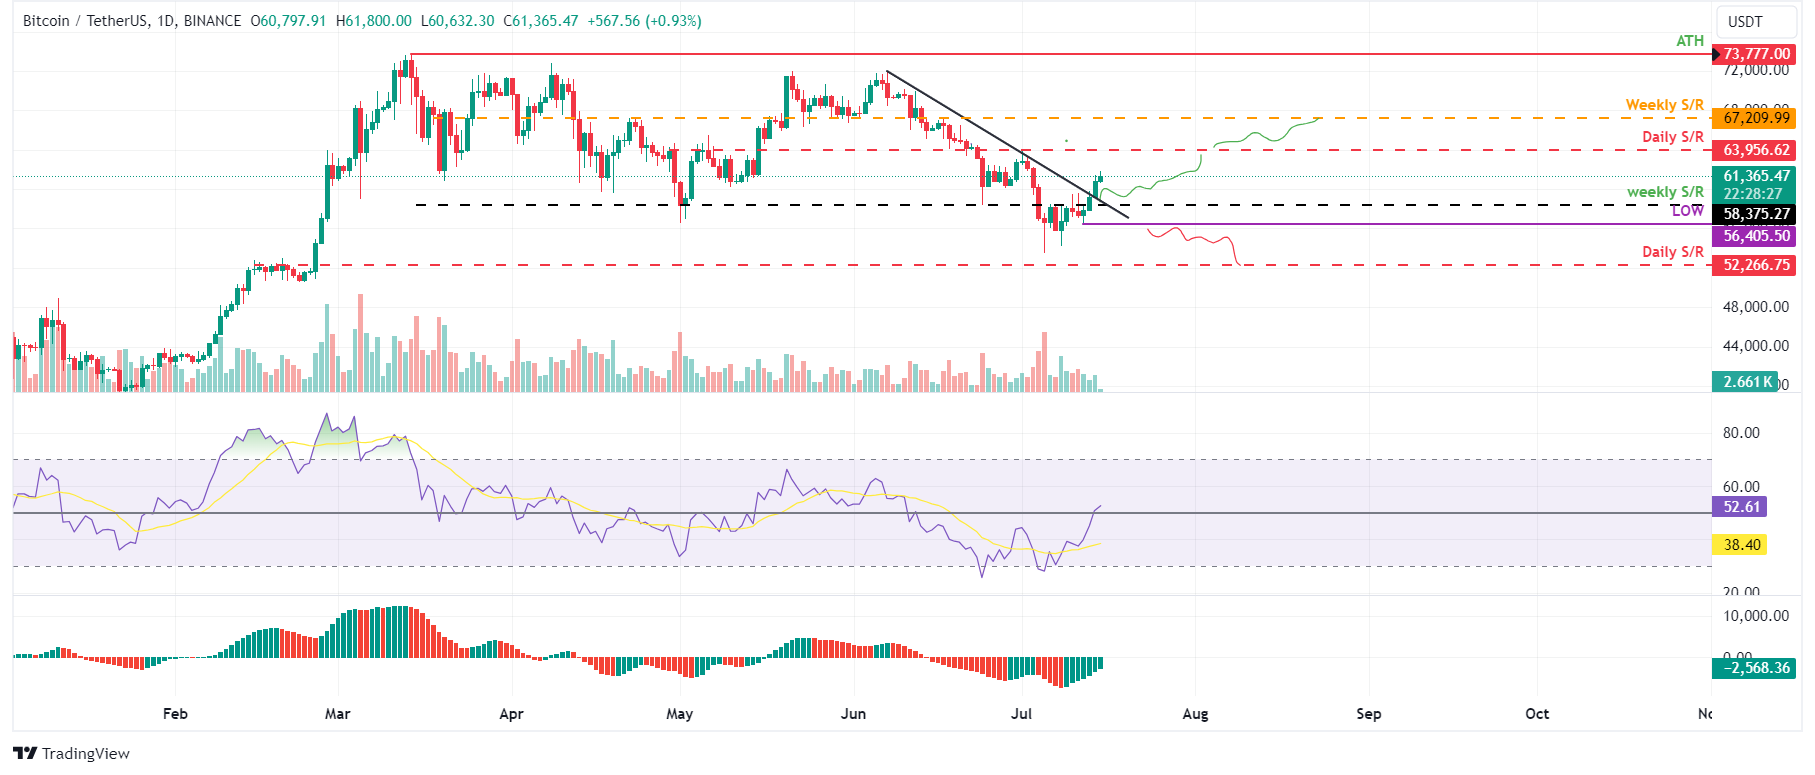
BTC/USDT daily chart
Conversely, if BTC closes below $56,405 and forms a lower low in the daily timeframe, it may signal persistent bearish sentiment. This scenario could trigger a 7.5% decline in Bitcoin’s price, targeting a revisit of its daily support at $52,266.
Ethereum price shows potential for further rally
Ethereum price broke above the $3,240 level on Sunday and, at the time of writing trades 0.87% up at $3,275 on Monday.
If the $3,240 level holds as support, ETH could increase 8.8%, targeting a retest of its daily high from July 1 at $3,524.
The Relative Strength Index (RSI) on the daily chart is trading above the neutral level of 50, and the Awesome Oscillator (AO) is on its way to doing the same. If bulls are indeed making a comeback, then both momentum indicators must maintain their positions above their respective mean levels. Such a development would add a tailwind to the recovery rally.
If the bulls are aggressive and the overall crypto market outlook is positive, and ETH closes above $3,524, it could extend an additional rise of 5.5% to retest its daily high of $3,717 from June 9.
ETH/USDT daily chart
On the other hand, if Ethereum's daily candlestick closes below $2,817, forming a lower low in the daily timeframe, it may signal persistent bearish sentiment. This scenario could trigger a 7% decline in Ethereum's price, targeting a revisit of its daily support at $2,621.
Ripple price shows potenti for the bulls
Ripple price broke above the daily resistance level of $0.499 on Saturday. Currently, it faces resistance around the $0.532 daily high level from June 5. At the time of writing, it trades 1.7% up at the $0.528 level.
If XRP closes above $0.532, it could rally 7.76% to retest its daily resistance level of $0.574.
On the daily chart, the Relative Strength Index (RSI) and the Awesome Oscillator (AO) are currently positioned above their critical thresholds of 50 and zero, respectively. These momentum indicators strongly indicate bullish dominance.
Furthermore, surpassing the $0.574 level could pave the way for an additional 12% rally to retest the next daily high, recorded on April 9, at $0.643.
XRP/USDT daily chart
However, if Ripple daily candlestick closes below $0.413, it indicates sustained bearish sentiment, forming a lower low in the daily timeframe. Such a scenario could lead to a 16% decline in Ripple's price, targeting a revisit of its low from March 12 at $0.347.
Information on these pages contains forward-looking statements that involve risks and uncertainties. Markets and instruments profiled on this page are for informational purposes only and should not in any way come across as a recommendation to buy or sell in these assets. You should do your own thorough research before making any investment decisions. FXStreet does not in any way guarantee that this information is free from mistakes, errors, or material misstatements. It also does not guarantee that this information is of a timely nature. Investing in Open Markets involves a great deal of risk, including the loss of all or a portion of your investment, as well as emotional distress. All risks, losses and costs associated with investing, including total loss of principal, are your responsibility. The views and opinions expressed in this article are those of the authors and do not necessarily reflect the official policy or position of FXStreet nor its advertisers.