Top 3 Price Prediction Bitcoin, Ethereum, Ripple: Bitcoin approaches its $56,000 support level
|
- Bitcoin nears the key daily support level of $56,000, eyeing for a recovery.
- Ethereum price faces resistance at $2,461, suggesting a downward trend and weak momentum.
- Ripple price retested and bounced above the 100-day EMA at $0.553, signaling a continuation of an upward trend.
Bitcoin (BTC) is approaching a crucial daily support level of $56,000, hinting at a possible recovery. At the same time, Ethereum (ETH) faced rejection from the resistance level, suggesting a downward trend with weak momentum. In contrast, Ripple (XRP) has bounced above the 100-day EMA, indicating a continued upward trend.
Bitcoin could bounce off support at $56,000 for a recovery
Bitcoin price failed to close above the 100-day Exponential Moving Average (EMA) at $60,685 and the descending trendline (drawn from multiple high levels from the end of July) on Friday.
It declined 3.78% in the next three days. At the time of writing on Tuesday, it continues to retrace down to $57,851.
If BTC continues to retrace down, it could find support around the daily level of $56,022. If this support holds, it could again attempt to break above the 100-day Exponential Moving Average (EMA) at $60,685 and the descending trendline.
The Relative Strength Index (RSI) and the Awesome Oscillator (AO) on the daily chart hover around their neutral levels of 50 and zero, indicating that neither the bulls nor the bears control the momentum. For the aforementioned bullish move to be sustained, both indicators must trade above their neutral levels.
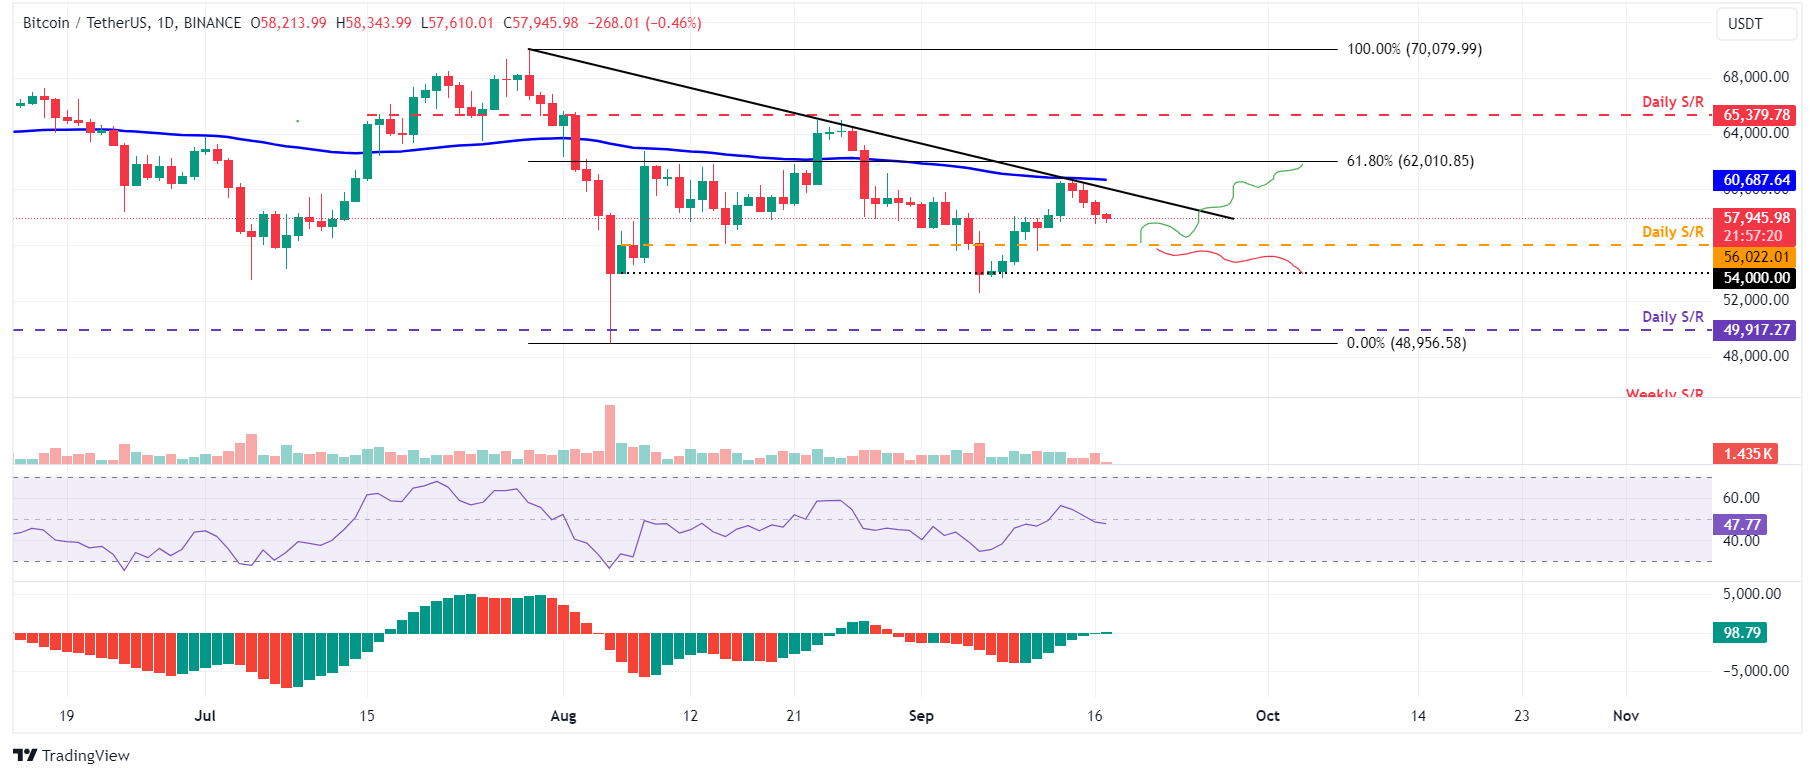
BTC/USDT daily chart
However, If BTC closes below the $56,022 daily support level, the bullish thesis will be invalidated. In this case, it could decline 3.6% to retest its psychologically important level at $54,000.
Ethereum shows signs of weakness
Ethereum price failed to close above the daily resistance level of $2,461 on Friday and declined 5.88% over the next three days. As of Tuesday, it continues to decline and trades at $2,275.
If $2,461 continues to hold as resistance, ETH could decline further by 5.6% from its current trading level to retest its September 6 low of $2,150.
The RSI and the AO on the daily chart trades below their neutral levels of 50 and zero. Both momentum indicators suggest the continuation of a bearish momentum.
ETH/USDT daily chart
However, the bearish thesis would be invalidated if ETH breaks and closes above the $2,461 resistance level. In such a scenario, ETH could rally 4% to retest its 61.8% Fibonacci retracement level at $2,564.
Ripple is poised for a rally after finding support around 100-day EMA
Ripple price broke and closed above the daily resistance level at $0.544 and the 100-day EMA at $0.553 on September 12. It rallied 6% the next two days, retraced and found support around the 100-day EMA at $0.533 on Monday. When writing on Tuesday, it trades above at $0.583.
If the 100-day EMA at $0.553 and the daily support at $0.544 continue to hold as support, XRP could continue its upward trend to retest its daily resistance level at $0.626.
The RSI and the AO on the daily chart trades above their neutral level of 50 and zero, respectively. Both indicators show that the bulls are in control, and the bullish momentum continues.
XRP/USDT daily chart
However, the bullish outlook would be invalidated if XRP’s daily candlestick closes below the $0.544 daily support level and breaks below the ascending trendline. In such a case, XRP would decline 7.5% to retest its September 6 low of $0.502.
Information on these pages contains forward-looking statements that involve risks and uncertainties. Markets and instruments profiled on this page are for informational purposes only and should not in any way come across as a recommendation to buy or sell in these assets. You should do your own thorough research before making any investment decisions. FXStreet does not in any way guarantee that this information is free from mistakes, errors, or material misstatements. It also does not guarantee that this information is of a timely nature. Investing in Open Markets involves a great deal of risk, including the loss of all or a portion of your investment, as well as emotional distress. All risks, losses and costs associated with investing, including total loss of principal, are your responsibility. The views and opinions expressed in this article are those of the authors and do not necessarily reflect the official policy or position of FXStreet nor its advertisers.