Toncoin price poised for a crash following a break below ascending trendline
|
- Toncoin price breaks below an ascending trendline, suggesting a change in market structure from bullish to bearish.
- On-chain data shows that TON's Exchange Flow balance is increasing, signaling a bearish move.
- A daily candlestick close above $7 would invalidate the bearish thesis.
Toncoin (TON) price broke below an ascending trendline on Tuesday, and as of Thursday, it is trading 3% around $6.50. On-chain data indicates that TON's Exchange Flow balance is increasing, suggesting potential further declines in Toncoin's price in the coming days.
Toncoin price sets for a crash after breaking below an ascending trendline
Toncoin price broke below an ascending trendline and the daily support level at $6.99 on Tuesday, failing to close above it the next day. The trendline is drawn by joining multiple swing low levels from mid-March to late July; a break below it signals a bearish move. As of Thursday, TON trades 3.84% lower at $6.59.
If this trendline holds as a pullback resistance at around $6.99, TON could crash 14% to retest the 61.8% Fibonacci retracement level of the rise between the May 1 low of $4.60 to the June 15 high of $8.28 at $6.00.
On the daily chat, this bearish thesis is supported by indicators like the Relative Strength Index (RSI) and Awesome Oscillator (AO). Both indicators are below their respective neutral levels of 50 and zero, strongly indicating bearish dominance.
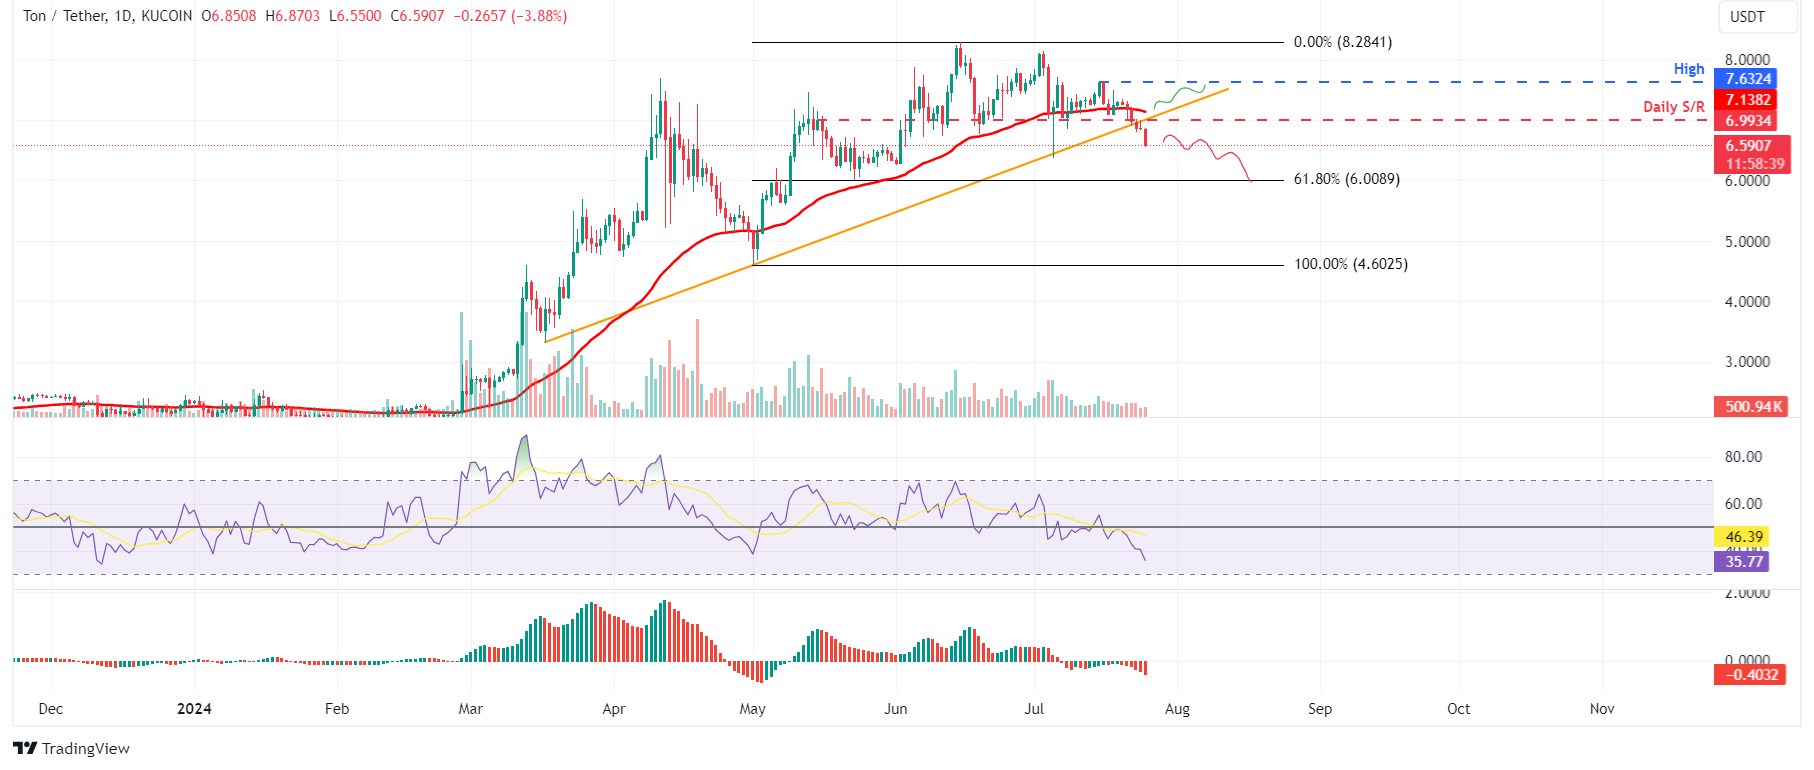
TON/USDT daily chart
On-chain data also points to a bearish outlook for Toncoin price. According to IntoTheBlock's In/Out of the Money Map (IOMAP), approximately 1,790 addresses bought 1.47 million TON tokens at an average price of $6.93. If the price rises at this level, a significant amount of investors may opt to sell to get a breakeven on their positions.
From a technical analysis perspective, the $6.93 resistance level aligns with the IOMAP findings, marking this zone as a crucial reversal point to monitor.
TON IOMAP chart
Santiment's Exchange Flow balance for TON shows the net movement of tokens into and out of exchange wallets. A positive value indicates more TON entered than exited, suggesting selling pressure from investors. Conversely, a negative value indicates more TON left the exchange than entered, indicating less selling pressure from investors.
In TON's case, the Exchange Flow balance has increased from -72,347 to 327,810 from July 21 to July 22, coinciding with a 3.3% price decline. This positive uptick in the Exchange Flow balance indicates increased selling activity among investors.
During this event, the TON Supply on Exchanges increased by 6% in one day, generally suggesting that investors are sending TON tokens to exchanges, thereby increasing the selling activity.
TON Exchange Flow Balance and Supply on Exchange chart
However, if TON's daily candlestick closes above $7 and establishes a higher high on the daily timeframe, it may signal a shift in market dynamics favoring bullish sentiment. Such a change could nullify the bearish outlook, leading to an 11% rally in the Toncoin price to the daily high of $7.63 on July 16.
Information on these pages contains forward-looking statements that involve risks and uncertainties. Markets and instruments profiled on this page are for informational purposes only and should not in any way come across as a recommendation to buy or sell in these assets. You should do your own thorough research before making any investment decisions. FXStreet does not in any way guarantee that this information is free from mistakes, errors, or material misstatements. It also does not guarantee that this information is of a timely nature. Investing in Open Markets involves a great deal of risk, including the loss of all or a portion of your investment, as well as emotional distress. All risks, losses and costs associated with investing, including total loss of principal, are your responsibility. The views and opinions expressed in this article are those of the authors and do not necessarily reflect the official policy or position of FXStreet nor its advertisers.