This technical formation could push TRON’s TRX price to $0.016
|
- TRON price is facing an immediate hurdle at $0.066 and is likely to get rejected if buyers fail to step in.
- A daily candlestick close below $0.055 will trigger a 72% downward move to $0.016.
- If TRX produces a decisive daily candlestick close above $0.081, it could trigger a bullish ascent to $0.140.
TRON price shows that its coil up is coming to an end, suggesting that a breakout is on its way. However, investors need to know that rejection at immediate resistance barriers could trigger a correction and an eventual breakdown.
TRON price readies for swift moves
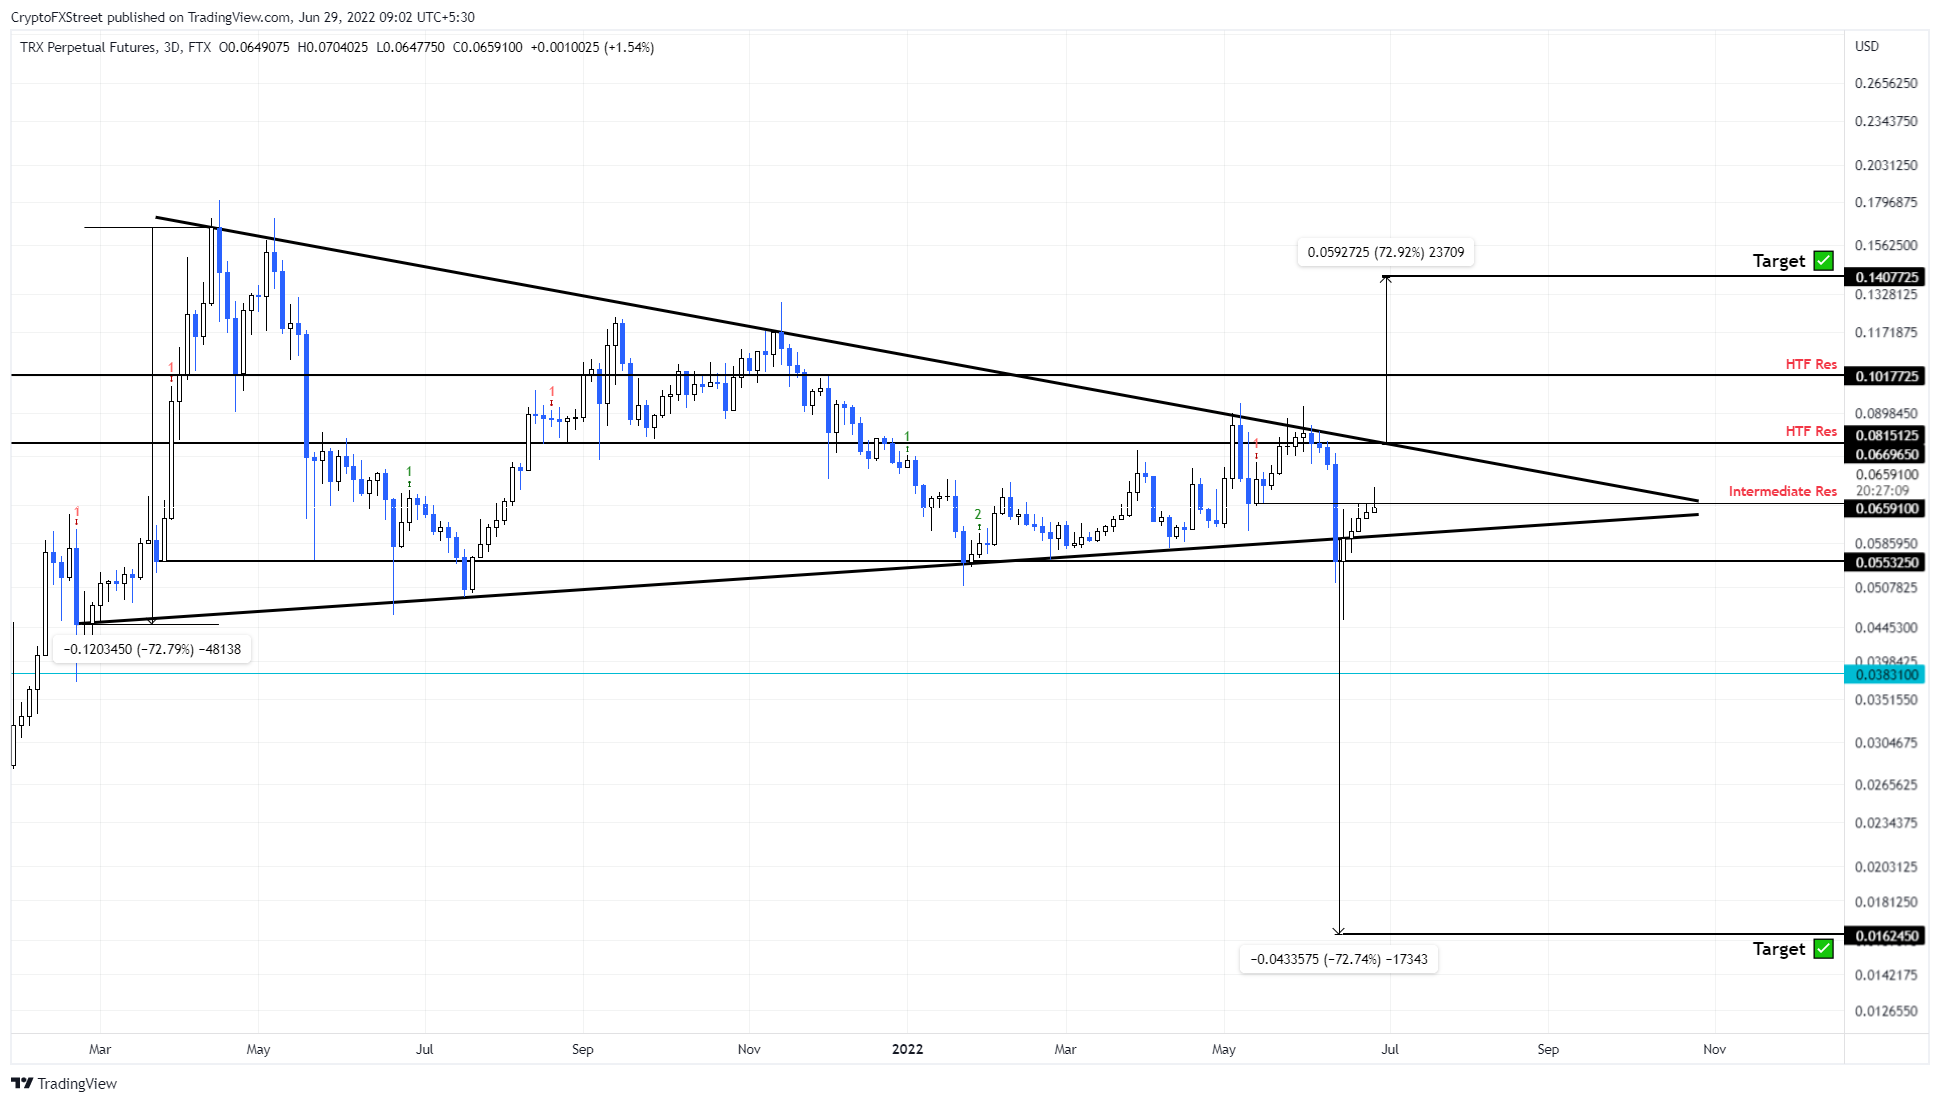
TRON price has been trapped between two converging trend lines connecting lower highs and higher lows since February 2021. The overall outlook suggests that TRX is traversing a symmetrical triangle.
This technical formation forecasts a 72% move, but the direction is unknown until the asset produces a decisive close above or below the triangle boundaries. Although TRON price looked bullish and showed signs of retesting the upper trend line one last time, it is facing headwinds.
TRX is currently trying to overcome the $0.065 resistance barrier, but a rejection here could suggest that the buyers are weak. This lack of bullish momentum could further push TRON price down to retest the lower boundary of the symmetrical triangle.
A daily candlestick close below $0.055 will trigger a breakdown from the said pattern. In such a case, measuring the 72% distance between the first swing high and swing low and adding it to the breakout point at $0.055 will reveal a target of $0.016.
Therefore, investors need to exercise caution when trading TRX. That said, TRON price has the $0.038 support level that could potentially absorb the selling pressure and cauterize the bleed.
TRX/USDT 2-day chart
On the other hand, if TRON price produces a daily candlestick close above $0.081, it will trigger a bullish breakout. In such a case, adding the target measure to the said level forecasts a 72% ascent to $0.140. However, the upswing will face a significant hurdle at $0.101.
Information on these pages contains forward-looking statements that involve risks and uncertainties. Markets and instruments profiled on this page are for informational purposes only and should not in any way come across as a recommendation to buy or sell in these assets. You should do your own thorough research before making any investment decisions. FXStreet does not in any way guarantee that this information is free from mistakes, errors, or material misstatements. It also does not guarantee that this information is of a timely nature. Investing in Open Markets involves a great deal of risk, including the loss of all or a portion of your investment, as well as emotional distress. All risks, losses and costs associated with investing, including total loss of principal, are your responsibility. The views and opinions expressed in this article are those of the authors and do not necessarily reflect the official policy or position of FXStreet nor its advertisers.

