The Graph price shoots up 30% in 24 hours, but the AI-token rally might be short-lived
|
- The Graph price rallied by more than 30% in a day, trading at a two-month high of $0.138.
- GRT leading the increase in the crypto market also led to realized profits hitting a monthly high.
- The MVRV ratio, along with price indicators, is suggesting a bearish outlook since the altcoin is sitting in the “danger zone”.
The Graph enjoyed the broader market bullish cues on Monday after Bitcoin scaled beyond the $31,000 mark. But in doing so, the AI token also opened up to the potential of a downfall for a reason that is dependent on its investors now.
The Graph price rally may face a hurdle
The Graph price led the crypto market rally over the past 24 hours, rising by more than 30% to trade at $0.138 at the time of writing. GRT first noted attention and gains during the Artificial Intelligence (AI) hype a few weeks ago and has since been on investors’ radar.
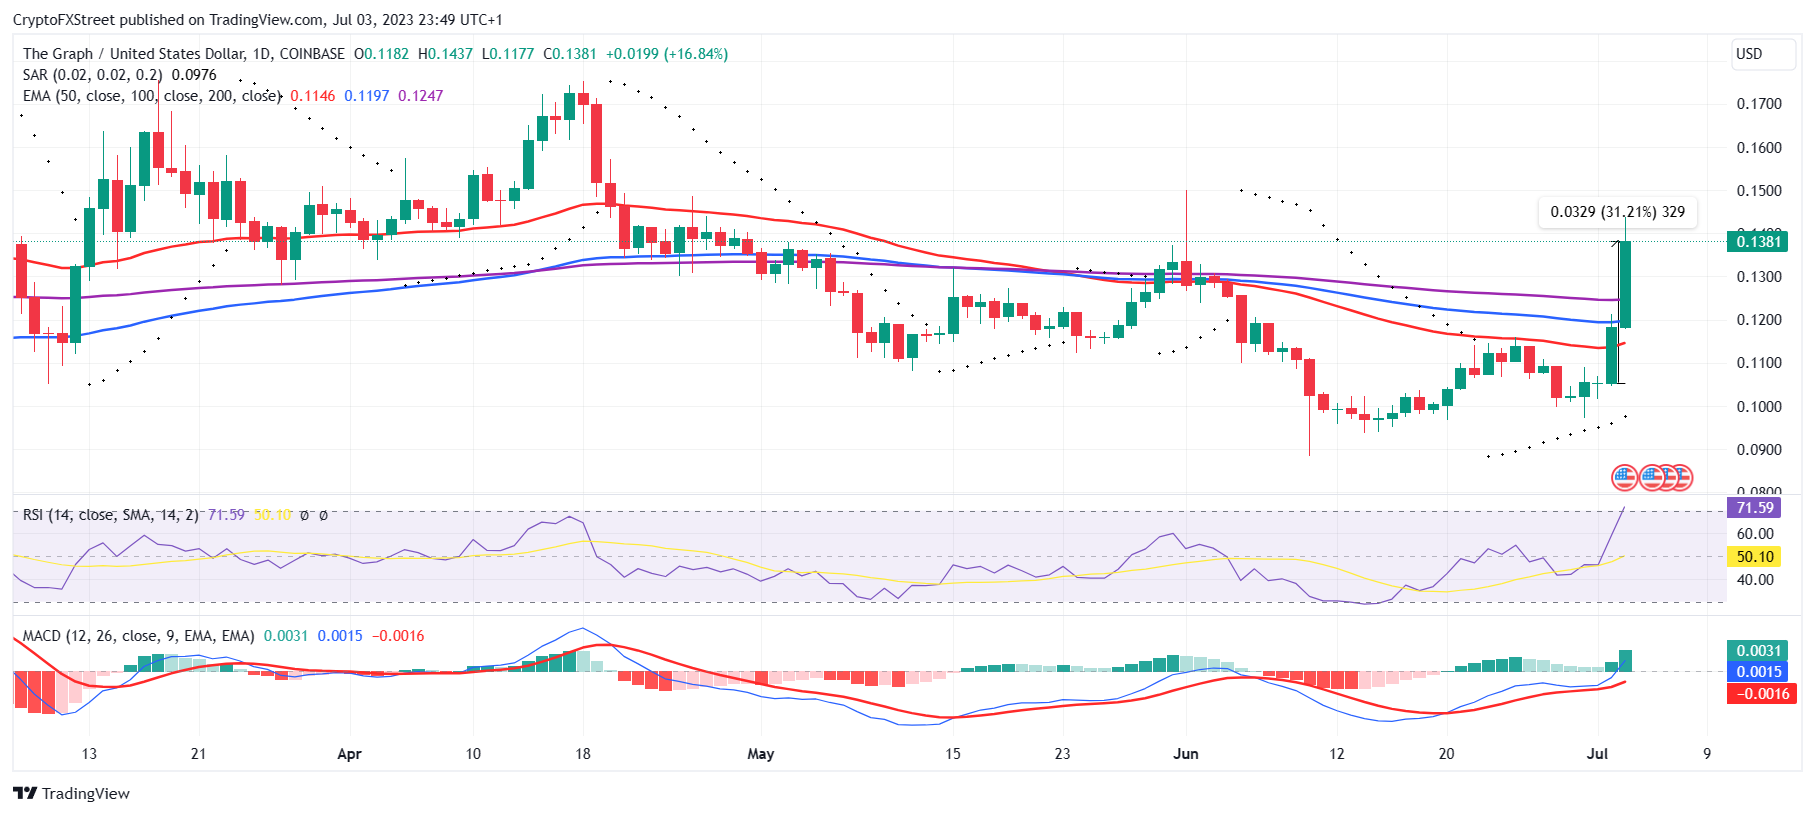
GRT/USD 1-day chart
Thus as soon as this rally was initiated, GRT holders had a hint of what could be coming and prepared themselves accordingly. Consequently, when the altcoin hit today’s highs, the investors decided to take profits. As a result, the realized profits across the network hit a monthly high of 3.35 million GRT.
The Graph realized profits
But what may not be anticipated by GRT holders is the fact that the altcoin is now very vulnerable to a decline for two reasons. The first is the signals obtained from the price indicators that highlight the potential for corrections. The Relative Strength Index (RSI) stepped into the overbought zone above 70.0. A breach into this zone usually proceeds with a market cool-down along with some price drawdown.
Secondly, the Market Value to Realzied Value (MVRV) ratio also entered the “danger zone” following the rally. In the case of GRT, the area above 7% is marked as the danger zone since it is synonymous with corrections historically.
The indicator marks the overall profit/loss of the investors, and usually, when the MVRV enters this zone, investors tend to sell for profit.
The Graph MVRV ratio
Thus if this notion stands to be true this time around as well, The Graph price might end up falling back down to $0.1251. This price point coincides with the 200-day Exponential Moving Average (EMA) and acts as an important support level for the altcoin.
Information on these pages contains forward-looking statements that involve risks and uncertainties. Markets and instruments profiled on this page are for informational purposes only and should not in any way come across as a recommendation to buy or sell in these assets. You should do your own thorough research before making any investment decisions. FXStreet does not in any way guarantee that this information is free from mistakes, errors, or material misstatements. It also does not guarantee that this information is of a timely nature. Investing in Open Markets involves a great deal of risk, including the loss of all or a portion of your investment, as well as emotional distress. All risks, losses and costs associated with investing, including total loss of principal, are your responsibility. The views and opinions expressed in this article are those of the authors and do not necessarily reflect the official policy or position of FXStreet nor its advertisers.