Tezos Price Prediction: XTZ commences colossal liftoff toward $5
|
- Tezos has just broken out of an ascending triangle pattern ahead of a 25% upswing.
- The MACD indicator supports the bullish narrative as it crosses into the positive territory.
- If the SuperTrend indicator fails to flip bullish, XTZ will have a hard time recovering to $5.
Tezos has recovered considerably and consistently from the dip on February 21. Initially, the 200 Simple Moving Average (SMA) hindered price movement in conjunction with the seller congestion at $4. However, XTZ has broken above a key technical pattern and is looking toward a massive move heading to $5.
Tezos bulls focus on sustaining the uptrend
Tezos is trading at $3.93 after breaking above two vital levels, the 200 Simple Moving Average (SMA) on the 4-hour chart and the triangle's hypotenuse. Ascending triangles are bullish continuation patterns. They signify periods of consolidation after an asset rises significantly in value.
The triangle has a bullish impulse and results in a breakout above the x-axis. A spike in volume would usually function as confirmation for the breakout. The upswing has a precise target, equal to the distance between the pattern's highest to lowest points.
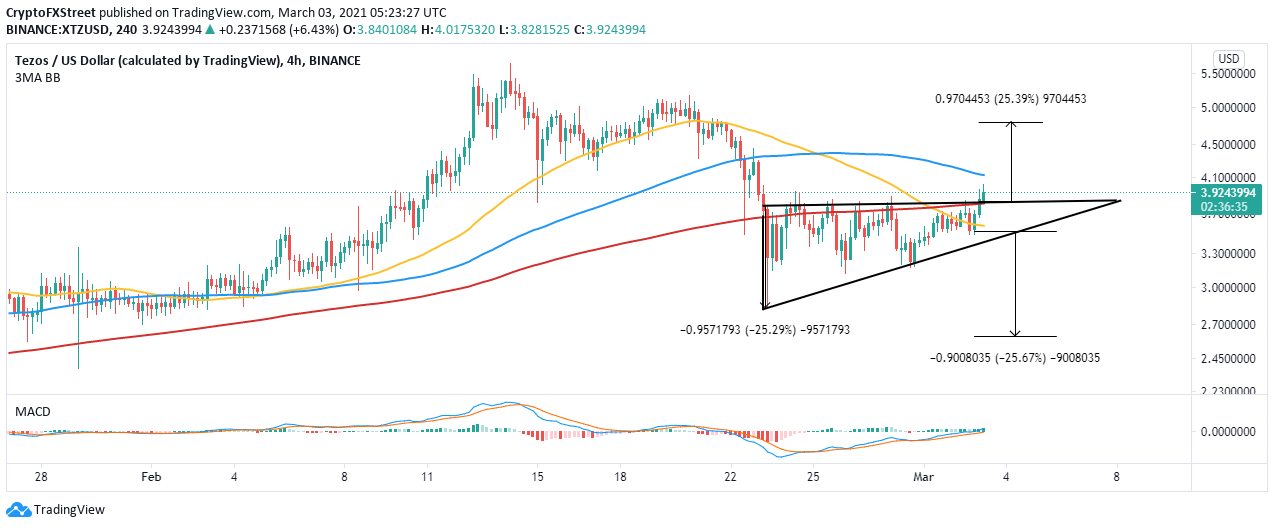
XTZ/USD 4-hour chart
A comprehensive look at the Moving Average Convergence Divergence (MACD) reinforces the bullish scenario. The MACD follows the trend of an asset and measures its real-time momentum. Traders can use the MACD to foresee entry and exit positions.
As the MACD line (blue) crosses above the signal line, it is recommended to buy in or increase your position. On the other hand, if the MACD line crosses under the signal line, it is advisable to sell or reduce your positions. For now, the indicator is vividly bullish for Tezos. Thus the uptrend to $5 is likely to continue.
Looking at the other side of the fence
The 4-hour SuperTrend indicator is bearish since the freefall on February 21. This indicator usually advises the trader to either short or long the asset. Despite the upswing from the support at $2.8, the SuperTrend indicator sends a bearish signal.
XTZ/USD 4-hour chart
Besides, the immediate resistance at $4 must come down for gains eying higher levels. Otherwise, Tezos will start to crumble under rising overhead pressure. Support at the 200 SMA on the 4-hour chart and the triangle's hypotenuse remains vital to the uptrend. If lost, selling pressure will surge, forcing XTZ back to $2.8.
Information on these pages contains forward-looking statements that involve risks and uncertainties. Markets and instruments profiled on this page are for informational purposes only and should not in any way come across as a recommendation to buy or sell in these assets. You should do your own thorough research before making any investment decisions. FXStreet does not in any way guarantee that this information is free from mistakes, errors, or material misstatements. It also does not guarantee that this information is of a timely nature. Investing in Open Markets involves a great deal of risk, including the loss of all or a portion of your investment, as well as emotional distress. All risks, losses and costs associated with investing, including total loss of principal, are your responsibility. The views and opinions expressed in this article are those of the authors and do not necessarily reflect the official policy or position of FXStreet nor its advertisers.