Tezos price needs a rally through $3.12 to activate the bulls
|
- Tezos price suspends rebound after striking critical resistance at $3.10.
- Rapidly declining 50-day simple moving average (SMA) exerting pressure on XTZ.
- 2019 trend line remains a key support level if price structure deteriorates.
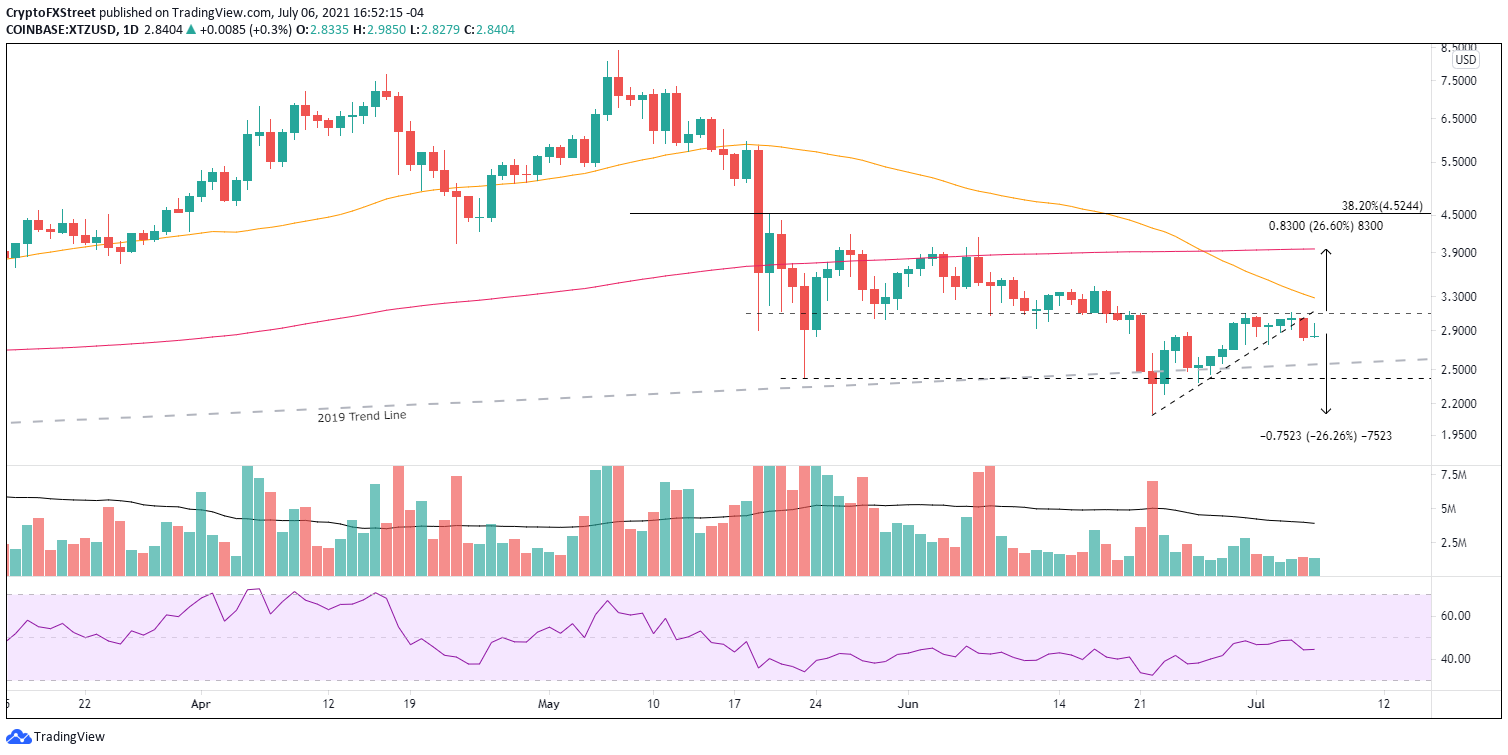
Tezos price rebound from below the May 23 low, and the 2019 trend line has not generated any upside in July after abruptly stalling at $3.10. The break below the minor trend line from June 22 may signal further weakness moving forward or an evolution in the price structure to a range-bound scenario, between the May 23 low of $2.42 and $3.10. Either way, XTZ is off-limits for long-term investors until a daily close above $3.12.
Tezos price offers alternatives, but a clear opportunity has yet to be revealed
Tezos price experienced a 37% decline in 2Q and a 16% slump in June after staging a rebound from below the longstanding 2019 trend line. The performance was not a wide deviation from the broad cryptocurrency complex and reflected a digital asset that rarely headlines the crypto news roll.
The 46% rebound from the June 22 low of $2.11 until the July 4 high of $3.11 enabled XTZ to recapture the 2019 trend line and the May 23 low of $2.42, but it was overshadowed by the bearish Death Cross pattern that activated on June 27.
Recently, Tezos price has been interrupted by the formidable resistance around $3.10 that was support in June before the plunge on June 21. Moreover, XTZ is weighed down by the declining 50-day SMA, currently at $3.28.
A daily close below $2.75 would confirm a stage of retracement that will likely persuade Tezos price to test the 2019 trend line now at $2.55 or even sweep the May 23 low of $2.42, logging a 15% decline from the current price.
If XTZ registers a daily close below the May 23 low, Tezos price will sweep the June 22 low of $2.11, generating a 26% decline from the current price. Any further support levels would need to be considered following a daily close below the June 22 low.
A second alternative Tezos price may opt for is a trading range underpinned by the 2019 trend line or the June 23 low, intercepted by the resistance around $3.10. It could establish a series of profitable opportunities for swing and day traders while frustrating long-term XTZ speculators.
A final scenario is for Tezos price to realize a daily close above $3.12 that invites an acceleration in buying demand and potentially a rally to the strategically important 200-day SMA, currently at $3.95. It would represent a 27% rally from $3.12, but XTZ would need to overcome the resistance established by the declining 50-day SMA at $3.28.
XTZ/USD daily chart
Tezos price is challenging XTZ investors with three potential investment storylines, none of which has taken the pole position. Based on the charts and meshed with the uncertainty governing many altcoins, it would be shrewd for long-term investors to let Tezos price activate the bulls with a close above $3.12 and then allocate capital if it is a high probability opportunity.
Information on these pages contains forward-looking statements that involve risks and uncertainties. Markets and instruments profiled on this page are for informational purposes only and should not in any way come across as a recommendation to buy or sell in these assets. You should do your own thorough research before making any investment decisions. FXStreet does not in any way guarantee that this information is free from mistakes, errors, or material misstatements. It also does not guarantee that this information is of a timely nature. Investing in Open Markets involves a great deal of risk, including the loss of all or a portion of your investment, as well as emotional distress. All risks, losses and costs associated with investing, including total loss of principal, are your responsibility. The views and opinions expressed in this article are those of the authors and do not necessarily reflect the official policy or position of FXStreet nor its advertisers.
