Stellar Price Prediction: XLM uptrend in jeopardy as multiple sell signals emerge
|
- Stellar becomes the biggest double-digit gainer in the top 50, following a 16% upswing.
- Sell signals on the 12-hour and daily chart hint at a possible correction in the near term.
Stellar spiked massively toward the end of the American session on Wednesday. As predicted, bulls regained control over the price, gearing up for gains above $0.2. However, the uptrend seems to have hit a tipping point, with XLM likely to make a significant correction.
Stellar’s uptrend in grave danger
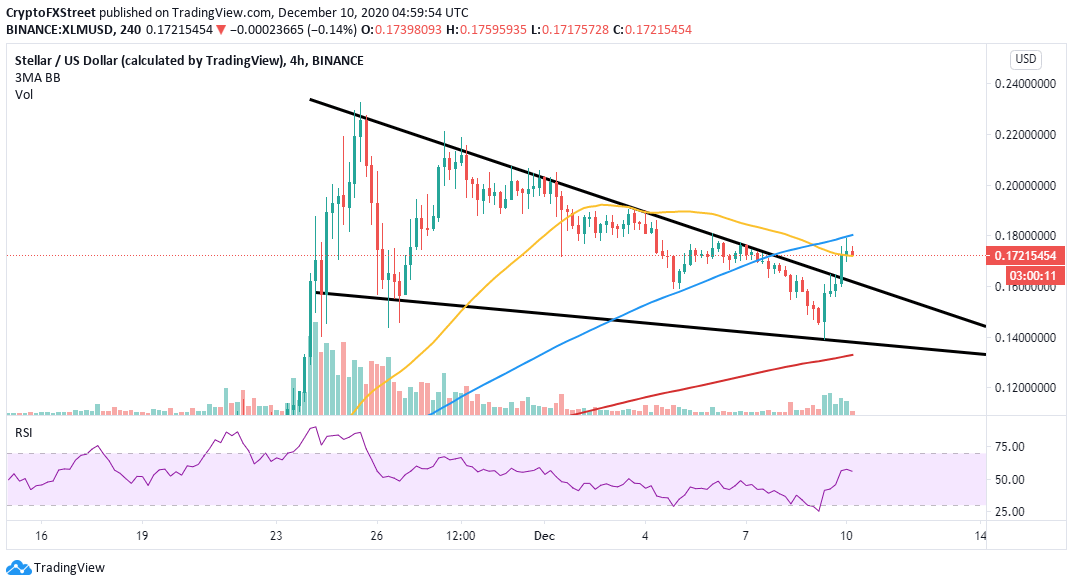
The impressive price action occurred as other digital assets searched for robust support levels following the recent losses. XLM/USD confirmed a breakout above a descending wedge pattern, boosting the price action towards $0.18.
Stellar price hit a weekly high at $0.179 after failing to tackle the seller congestion at the 100 Simple Moving Average on the 4-hour chart. At the time of writing, XLM is trading at $0.172 while holding above the immediate support provided by the 50 SMA.
A bearish narrative will come into the picture if Stellar closes the day under the short term moving average support. With overhead pressure mounting under the 100 SMA, the cross-border token is likely to resume the downtrend. Besides, the Relative Strength Index shows that the bearish grip could get sturdy in the near term.
XLM/USD 4-hour chart
The TD Sequential indicator has flashed a couple of sell signals on the 12-hour and daily charts. The calls to sell manifested in green nine candlesticks. If validated, the bearish outlook will see Stellar correct in one to four candlesticks. Similarly, the crypto may get into an extended retreat if supply increases in the coming few days.
XLM/USD 12-hour/daily charts
Stellar’s potential downtrend is likely to stretch to the next support at $0.16. However, if this support is bypassed, bulls will be forced to settle for the anchor at $0.14. Here, they are likely to rebuild the uptrend again.
On the flip side, buyers may well continue with the most recent gains if they can protect the support at the 50 SMA as if their lives depend on it. Trading above the 50 SMA might elevate the crypto to price levels around $0.2. The RSI is not yet oversold; therefore, room for growth is still available.
Information on these pages contains forward-looking statements that involve risks and uncertainties. Markets and instruments profiled on this page are for informational purposes only and should not in any way come across as a recommendation to buy or sell in these assets. You should do your own thorough research before making any investment decisions. FXStreet does not in any way guarantee that this information is free from mistakes, errors, or material misstatements. It also does not guarantee that this information is of a timely nature. Investing in Open Markets involves a great deal of risk, including the loss of all or a portion of your investment, as well as emotional distress. All risks, losses and costs associated with investing, including total loss of principal, are your responsibility. The views and opinions expressed in this article are those of the authors and do not necessarily reflect the official policy or position of FXStreet nor its advertisers.
