Shiba Inu price stabilizes while SHIB remains on track to hit $0.000054
|
- Shiba Inu price action shows surprising resiliency as major cryptos show bigger losses.
- SHIBA remains extremely bearish on the Ichimoku Chart, but the Point and Figure chart shows a bullish reversal in progress.
- Downside risks remain extensive if support fails to hold.
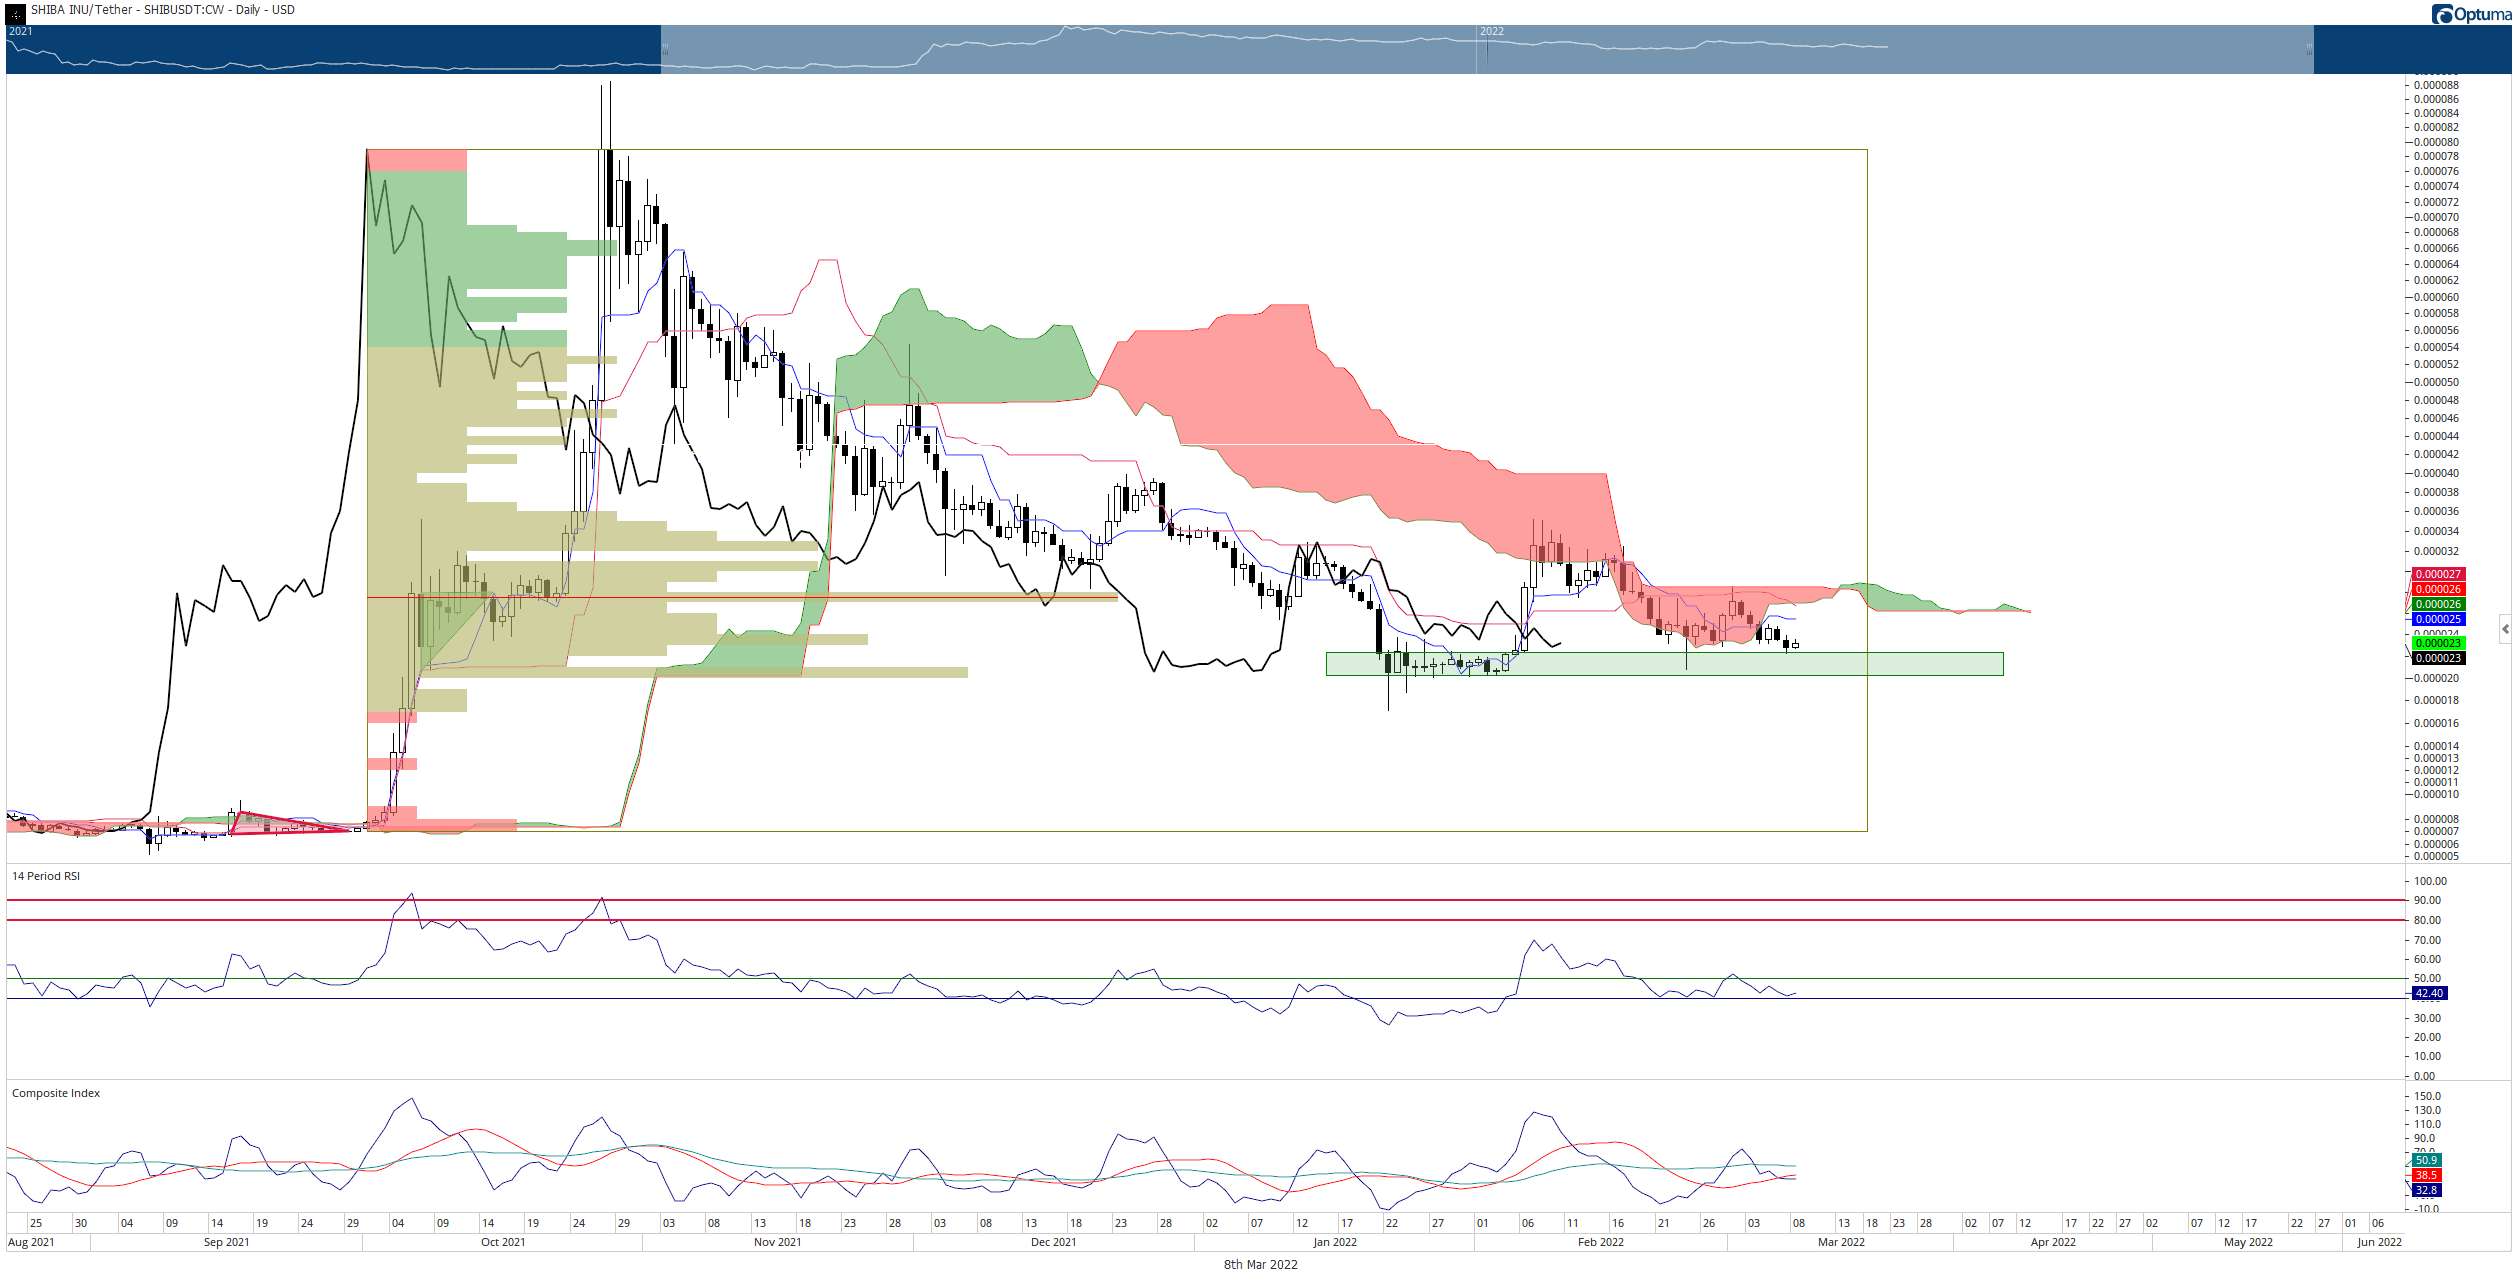
Shiba Inu price continues to trade lower but has stabilized relative to the rest of the cryptocurrency market. While the Ichimoku chart shows extremely bearish trading conditions, sellers have been unable or unwilling to capitalize on that weakness.
Shiba Inu price holds the $0.000022 support zone and prepares for a likely bullish extension move
Shiba Inu price action, from an Ichimoku perspective, is extremely bearish. SHIBA recently confirmed an Ideal Bearish Ichimoku Breakout last Friday (March 4, 2022) and has since traded lower, but not extensively. It is currently just above a prior resistance zone turned support at a $0.000022 value area.
$0.000022 is the primary support structure for Shiba Inu price before it would fall, and retest the lows of the January – February range in the $0.000020 price range. Below that, the Volume Profile is nearly empty, suggesting a swift move to the next high Volume Node, which doesn’t appear until 0.000008. While a move to that low is unlikely, it remains probable.
SHIBA/USDT Daily Ichimoku Kinko Hyo Chart
While the daily Ichimoku chart points to a bearish continuation as the most likely direction for Shiba Inu price, the Point and Figure chart show a different setup. The hypothetical long entry from several weeks ago remains valid.
The hypothetical long entry for Shiba Inu price was a buy stop order on the three-box reversal of Xs that formed off the previous O-column. That entry was triggered at $0.00002800. The entry is still valid. The stop loss is at $0.00001200, and the profit target is $0.00004540. The trade represents a 4.33:1 reward for the risk setup. A trailing stop of two to three boxes would help protect any profit made post entry.
SHIBA/USDT $0.0000025/3-box Reversal Point and Figure Chart
The long trade idea is invalidated if Shiba Inu price falls to $0.000014 or lower before the entry is triggered. However, if SHIBA continues to move lower, the entry and stop-loss move in tandem – but the profit target remains the same.
Information on these pages contains forward-looking statements that involve risks and uncertainties. Markets and instruments profiled on this page are for informational purposes only and should not in any way come across as a recommendation to buy or sell in these assets. You should do your own thorough research before making any investment decisions. FXStreet does not in any way guarantee that this information is free from mistakes, errors, or material misstatements. It also does not guarantee that this information is of a timely nature. Investing in Open Markets involves a great deal of risk, including the loss of all or a portion of your investment, as well as emotional distress. All risks, losses and costs associated with investing, including total loss of principal, are your responsibility. The views and opinions expressed in this article are those of the authors and do not necessarily reflect the official policy or position of FXStreet nor its advertisers.

