Shiba Inu price sees whales buying every offer in sight, expect a 30% breakout
|
- Shiba Inu price jumps over 4% on the back of a bullish breakout Monday morning.
- SHIB sees the bears defending the topside at the 55-day SMA.
- Expect a further rally continuation if bulls can trigger a close above a technical element.
Shiba Inu (SHIB) price is jumping higher this morning as markets are still assessing the jobs report from this past Friday. The stronger point shows resilience in the US job market against higher rates from the Fed and puts on the table the possible Goldilocks scenario wherein the Fed keeps hiking while no major job losses occur and the economy keeps growing. That would massively support equities and create a tailwind for cryptocurrencies this Monday.
SHIB takes flight on Goldilocks aspirations
Shiba Inu is baffling traders this morning with a jaw-breaking move to the upside as, at one point, an 8% gain was printed intraday in the ASIA PAC session. That move higher came off the back of easing measures from the Chinese government, letting further loose its Covid policy. With the hope for a soft landing in the US as the US job numbers showed a very resilient job market, sentiment might trigger a turnaround as the Fed is nearing its pivot and historically often quickly starts to cut rates after that.
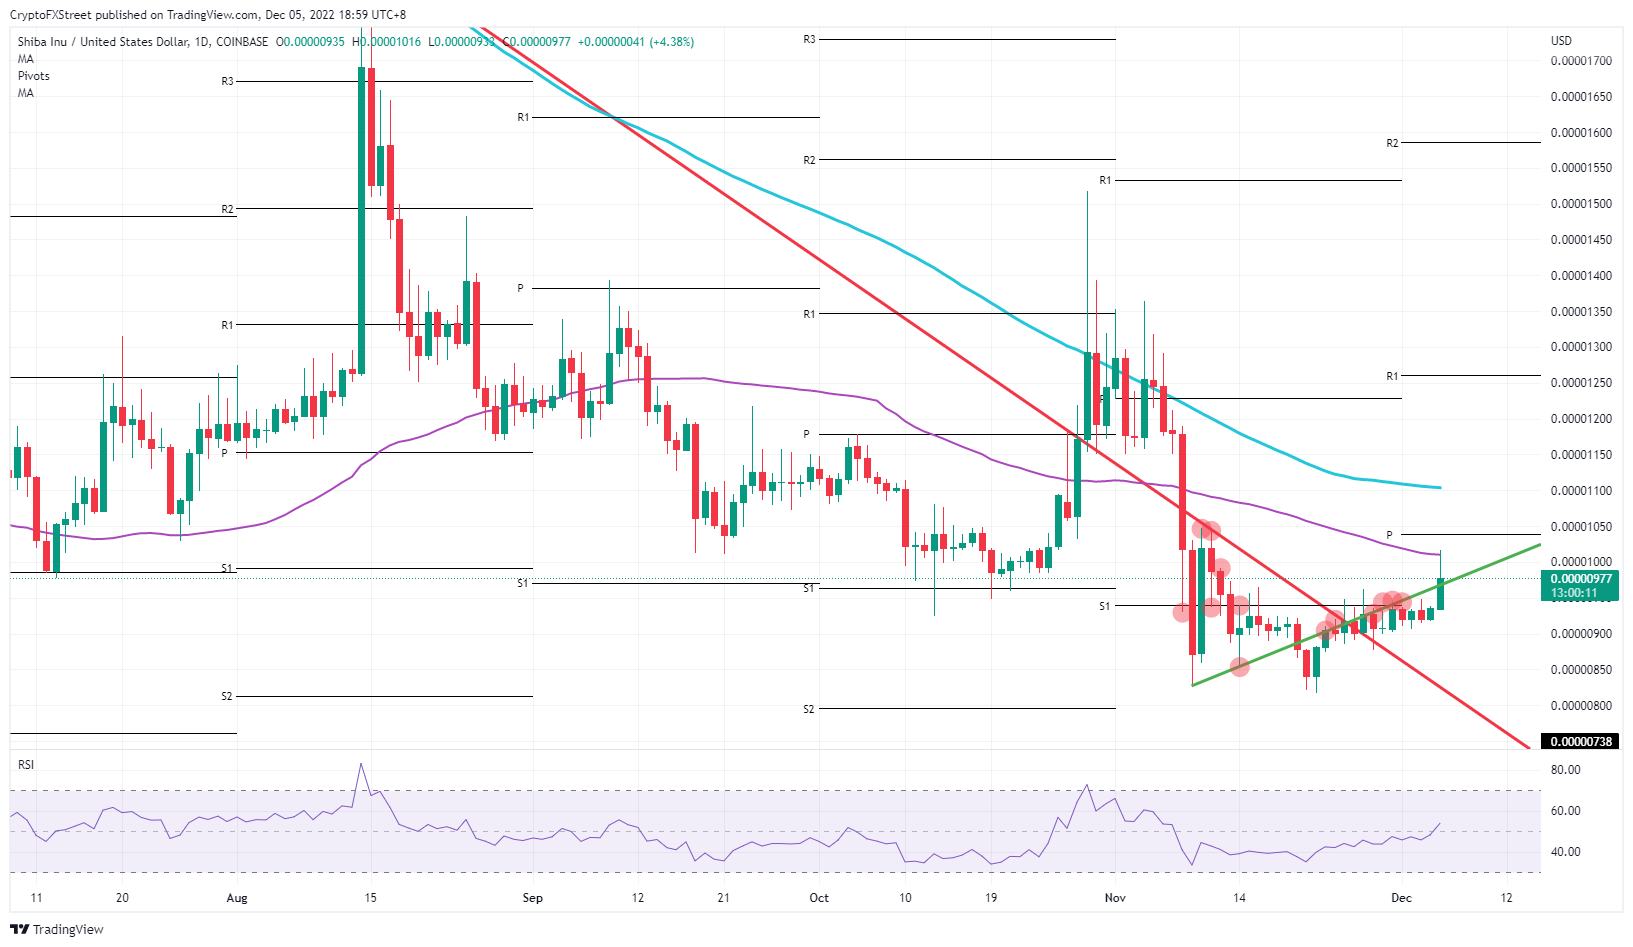
SHIB has just one important job to do today: closing above the green ascending trend line to support the current breakout. This way, bulls can reclaim the region above the trend line and put it back to good use to support the rally. Expect to see the 55-day Simple Moving Average (SMA) and the 200-day SMA near $0.00001100 before hitting $0.00001250 near the monthly R1 resistance level for December.
SHIB/USD daily chart
The current equilibrium between all asset classes is very fragile at the moment. A, a single headline or comment from a Fed member that mentions something other than what markets are expecting could easily break down the current correlations at hand. That would mean that the mentioned tailwind from equities could fall apartbreak down quickly and even become a headwind, triggering a drop below the green ascending trend line. Expect support to come in near $0.00000900.
Information on these pages contains forward-looking statements that involve risks and uncertainties. Markets and instruments profiled on this page are for informational purposes only and should not in any way come across as a recommendation to buy or sell in these assets. You should do your own thorough research before making any investment decisions. FXStreet does not in any way guarantee that this information is free from mistakes, errors, or material misstatements. It also does not guarantee that this information is of a timely nature. Investing in Open Markets involves a great deal of risk, including the loss of all or a portion of your investment, as well as emotional distress. All risks, losses and costs associated with investing, including total loss of principal, are your responsibility. The views and opinions expressed in this article are those of the authors and do not necessarily reflect the official policy or position of FXStreet nor its advertisers.
